


The State of the Nonprofit Sector
Nonprofits have tremendous economic impact in Greater Louisville & Southern Indiana.
We all profit when nonprofits thrive.
Published June 2023
Brought to you by:
Sponsored by:
INTRODUCTION
____
A letter from CNPE’s CEO and Board Chair
Nonprofit organizations provide opportunity for our community
Dear Reader,
Both of us have spent significant parts of our careers in the nonprofit sector. We believe that it represents the best of America, a place where people invest their whole hearts, where they live out their ideals and aspirations.
Whether we are volunteers, board members, staff members or clients… all of us come away from our interactions with nonprofits fortified and renewed.
This report paints a rich and complicated picture of a sector that not only touches lives – but helps drive the economy of Greater Louisville and Southern Indiana. The data also raises important questions – illuminating the challenges that will shape the rest of the decade.
Nonprofits work toward the common good – whether that’s by helping stray pets, working to reduce crime, addressing housing challenges, feeding the hungry, providing mental health services, investing in the arts, or promoting job training and learning. People of every faith, every race, and every point on the political compass – all come together to invest both their money and their time in something larger than themselves.
Our commitment at CNPE has always been to help nonprofits do good, better. Our intention is for this report to lift up the entire sector – both its strengths and its challenges. This report will help us face the future with a clear-eyed understanding of where we stand, and what’s at stake.
We encourage you to share this State of the Nonprofit Sector report with your coworkers and colleagues, your elected officials, your partners in business and government, your board members, and your volunteers. We also encourage you to share with us your reactions to this report. You can send your questions and thoughts to communications@cnpe.org. Together, we can continue to strengthen this vital sector of our economy, because we all profit when nonprofits thrive!
Sincerely,


Acknowledgements
We would like to thank our presenting sponsors, Dean Dorton and Baird, for making this report possible.
We would also like to thank The Greater Louisville Project, which was an important partner in gathering the data for this report and providing expertise, through the work of Harrison Kirby. From the CNPE team, Garrison Cox, Ed Cortas, Beverly Bartlett, and Ann L. Coffey helped shape the document by identifying key themes, writing and editing the report.
We would also like to thank the CNPE staff, Board of Directors, funders, and partners for ensuring that CNPE serves the nonprofit sector and community to fulfill our mission.
CNPE’s mission is to accelerate the success of nonprofits through capacity building, connections, and community support to amplify the good work of the sector.
A Summary for Busy People
This report is important, but we know all of us are strapped for time. So, here’s a summary:
- Nonprofit organizations have a huge direct economic impact in the 10 counties we analyzed as "Greater Louisville and Southern Indiana." This impact can be measured by:
- the more than 40,000 employees who work in those 10 counties and make up the fourth largest sector by employment in Louisville Metro
- the more than $1.7 billion payroll in the 10-county area
- the more than $4 billion in revenue in the 10-county area
- This direct economic impact of nonprofit organizations doesn’t begin to count the positive economic effect of all the good work done by nonprofit organizations. Education and job training, tourism, health care, and human services – all of these services have economic benefits that this report doesn’t quantify.
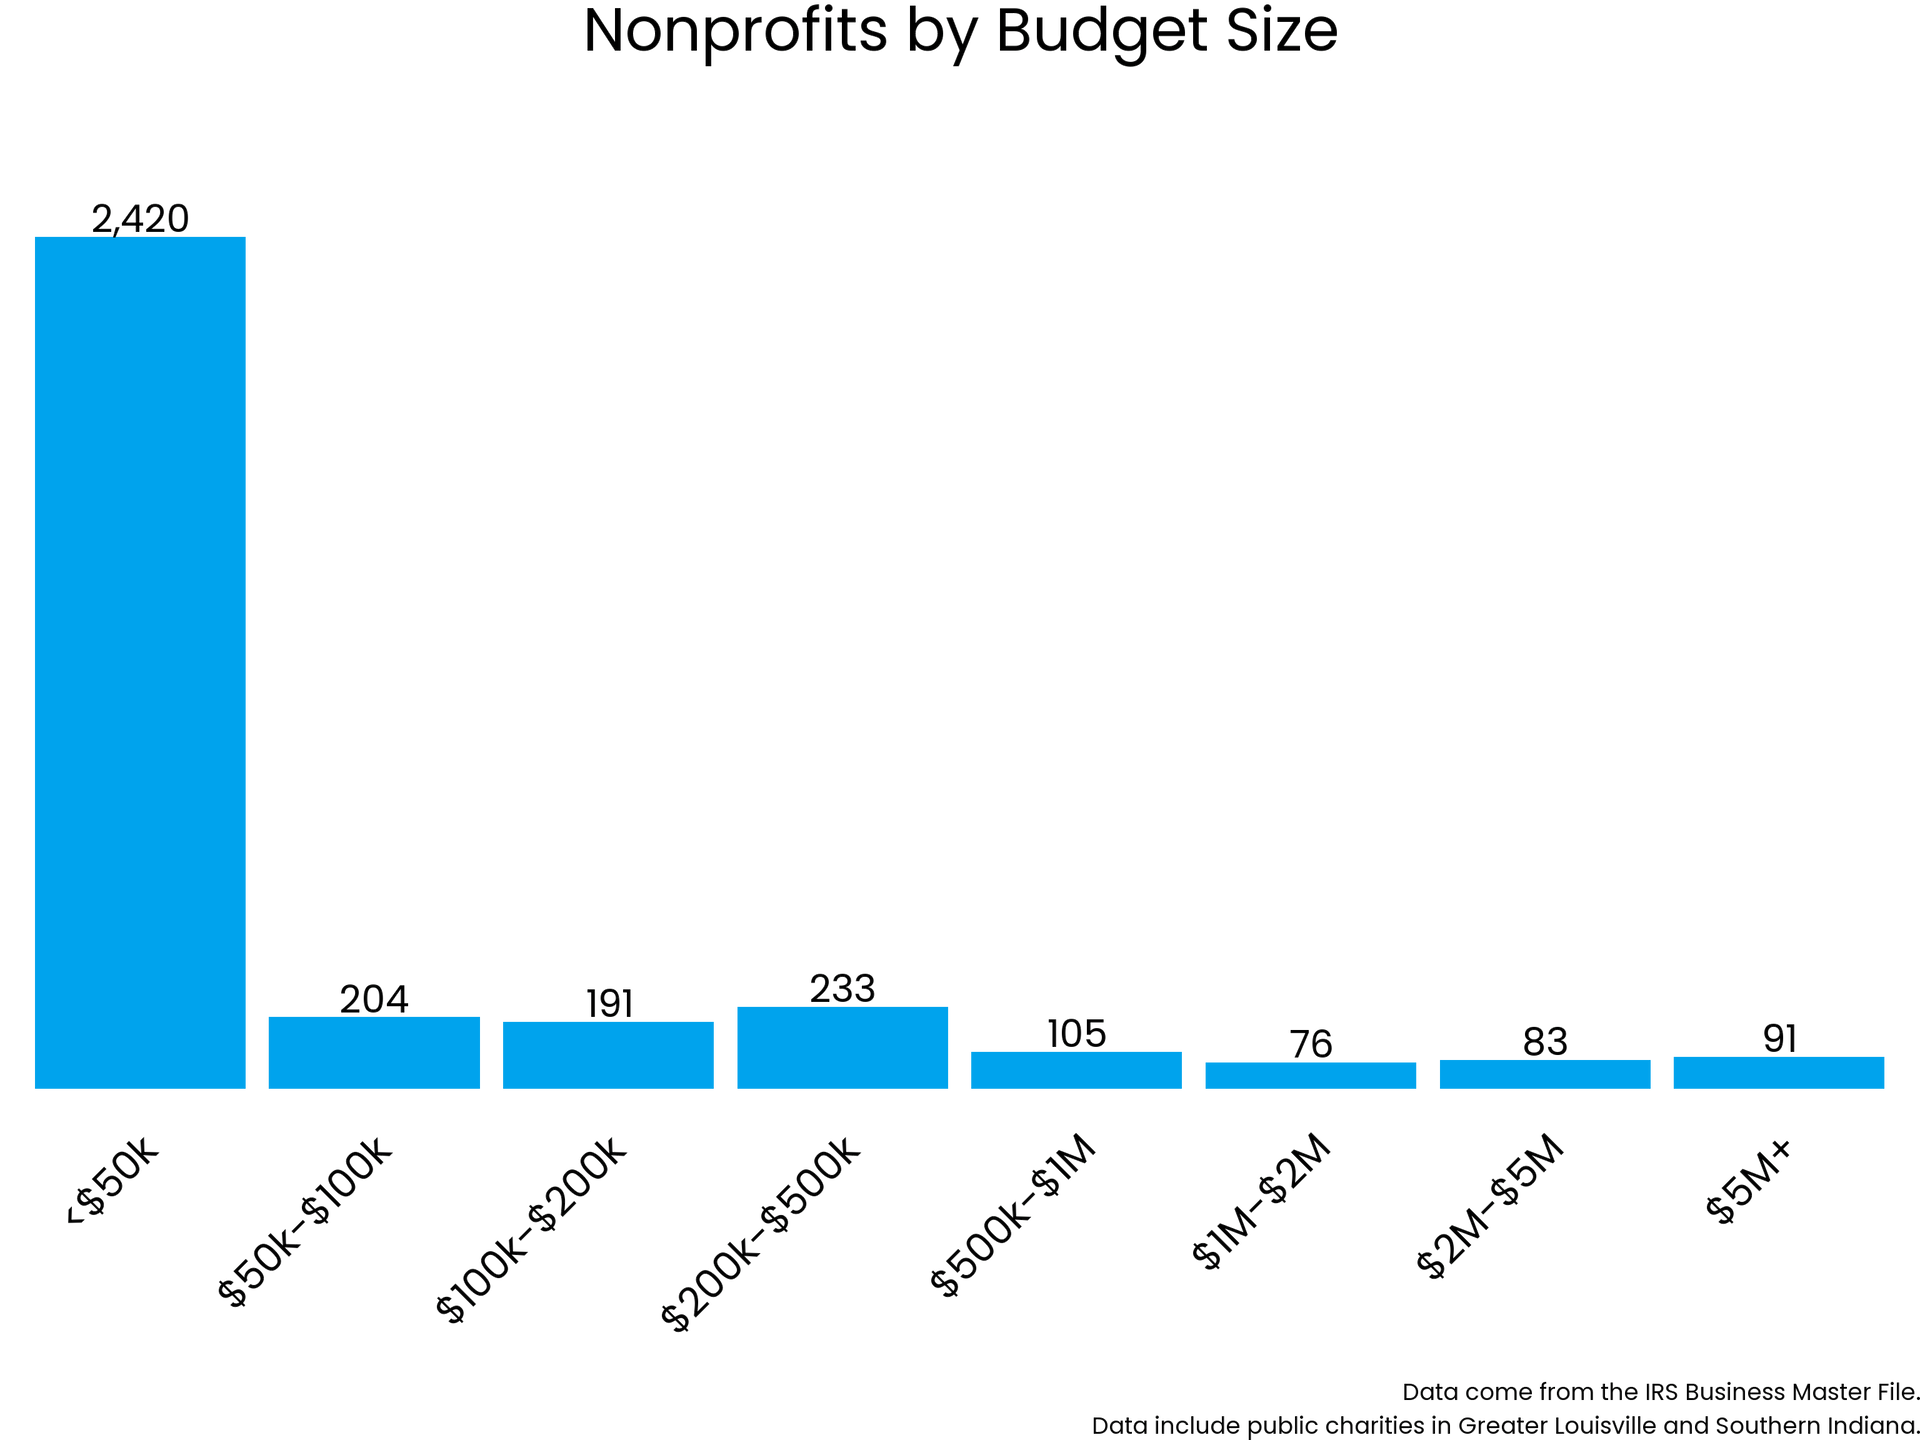
- While that total impact is large, most individual nonprofit organizations are small. Of the 3,872 nonprofit organizations in the region, 2,420 (62%) have revenue of less than $50,000 a year (which can include no revenue). Only 490 have employees.
- Revenue for nonprofit organizations is declining or flat when adjusted for inflation since 2017, even as the problems we are trying to address have grown in complexity and scope.
- Some nonprofit organizations may also face a fiscal cliff in 2025, when American Rescue Plan funds end.
As another example, there has been a 66% reduction in Louisville Metro Government funding since 2004, when adjusted for inflation.
- When compared with peer cities, Greater Louisville and Southern Indiana have fewer nonprofit organizations than average per capita in almost every category.
- Nonprofit organizations are facing many challenges – wage pressures that affect recruiting and retaining staff, questions about equity in funding across our community, and the need to find new approaches for revenue growth.
Defining Terms: What Do We Mean By "Nonprofits"?
In this report, the term nonprofit means the 3,872 organizations that the IRS calls “public charities”
– even though that is just one subset of all 501(c) organizations.
The IRS says there are 6,699 organizations in Greater Louisville and Southern Indiana that have status as a 501(c). This includes:
- 943 churches
- 458 foundations and trusts
- 80 nonprofit schools
- 51 nonprofit hospitals
- 3,872 public charities
While all of those organizations have “nonprofit status," many of them are not really the kind of nonprofits people are thinking of when they use that term.
For example, under federal tax law, a labor union is a "nonprofit," as are many cemeteries, hospitals, foundations, and faith communities.
We use the term "nonprofit" because that is what most people use in casual conversation and because many people consider the term “public charities” outdated as it doesn’t adequately describe the impact of the work. Even the word “nonprofit” is inadequate to describe all that this sector does. Some people refer to it as the civic, volunteer, benefit or social impact sector. Words create worlds – and the language we choose is important. But it’s difficult to get consensus around one word that adequately describes this complex, powerful, and important sector. For now, we continue to use the term “nonprofit.”
What do we mean when we say “Greater Louisville and Southern Indiana”?
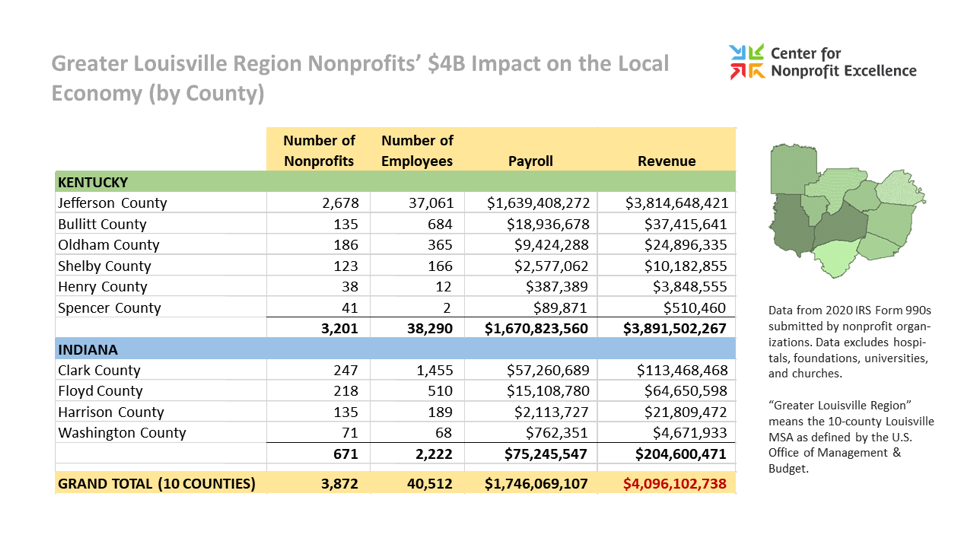
This report includes data from 10 counties in two states. We are talking about this entire area when we say “Greater Louisville and Southern Indiana.” It includes Jefferson, Bullitt, Oldham, Shelby, Henry, and Spencer counties in Kentucky and Clark, Floyd, Harrison, and Washington counties in Southern Indiana.
When was this data collected?
This data was gathered in late 2022, using the most current data then available – which were generally from 2020 or 2021.
NONPROFIT ORGANIZATIONS BY THE NUMBERS
____
Together we have a large impact.
>3800
Organizations in 10 Counties
$4 Billion
Total Revenue
$1.7 Billion
Payroll Totals
But most individual nonprofits are small.
<500
organizations have any paid employees.
70%
have annual revenues of <$50,000
ECONOMIC IMPACT OF NONPROFITS:
JOBS, PAYCHECKS AND REVENUE
____
Nonprofit organizations have a postive economic impact on more than just the households of the people they employ. By providing childcare, healthcare, job training, and other services, they enable many people to participate in the workforce who otherwise might not be able to.
But in this section, we are looking at the direct economic impact. The Nonprofit Sector is a significant employer in Greater Louisville and Southern Indiana, directly supporting tens of thousands of households.
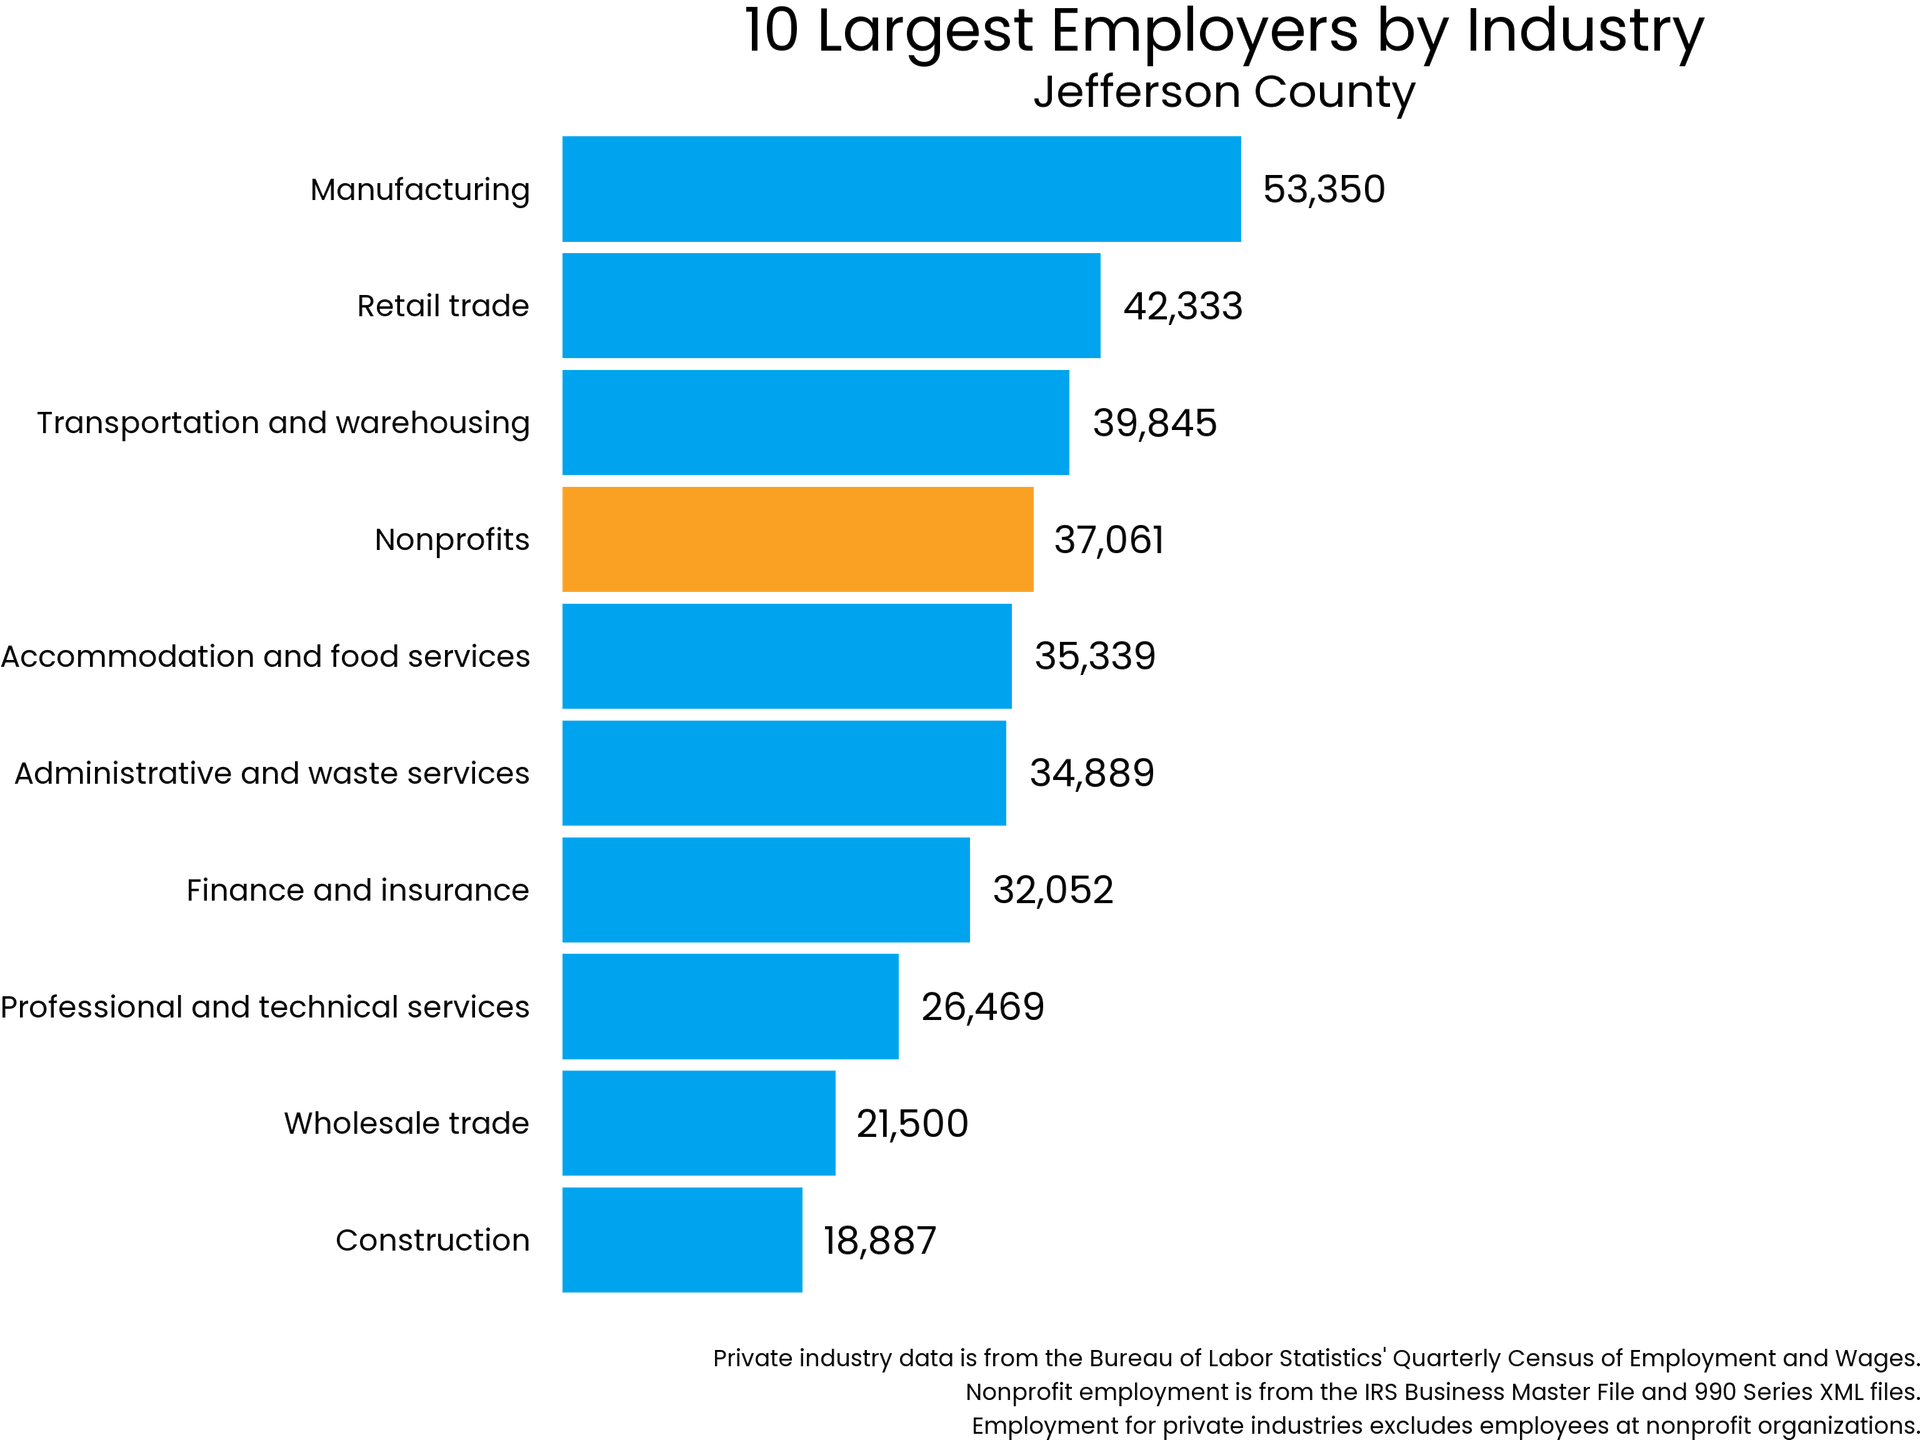
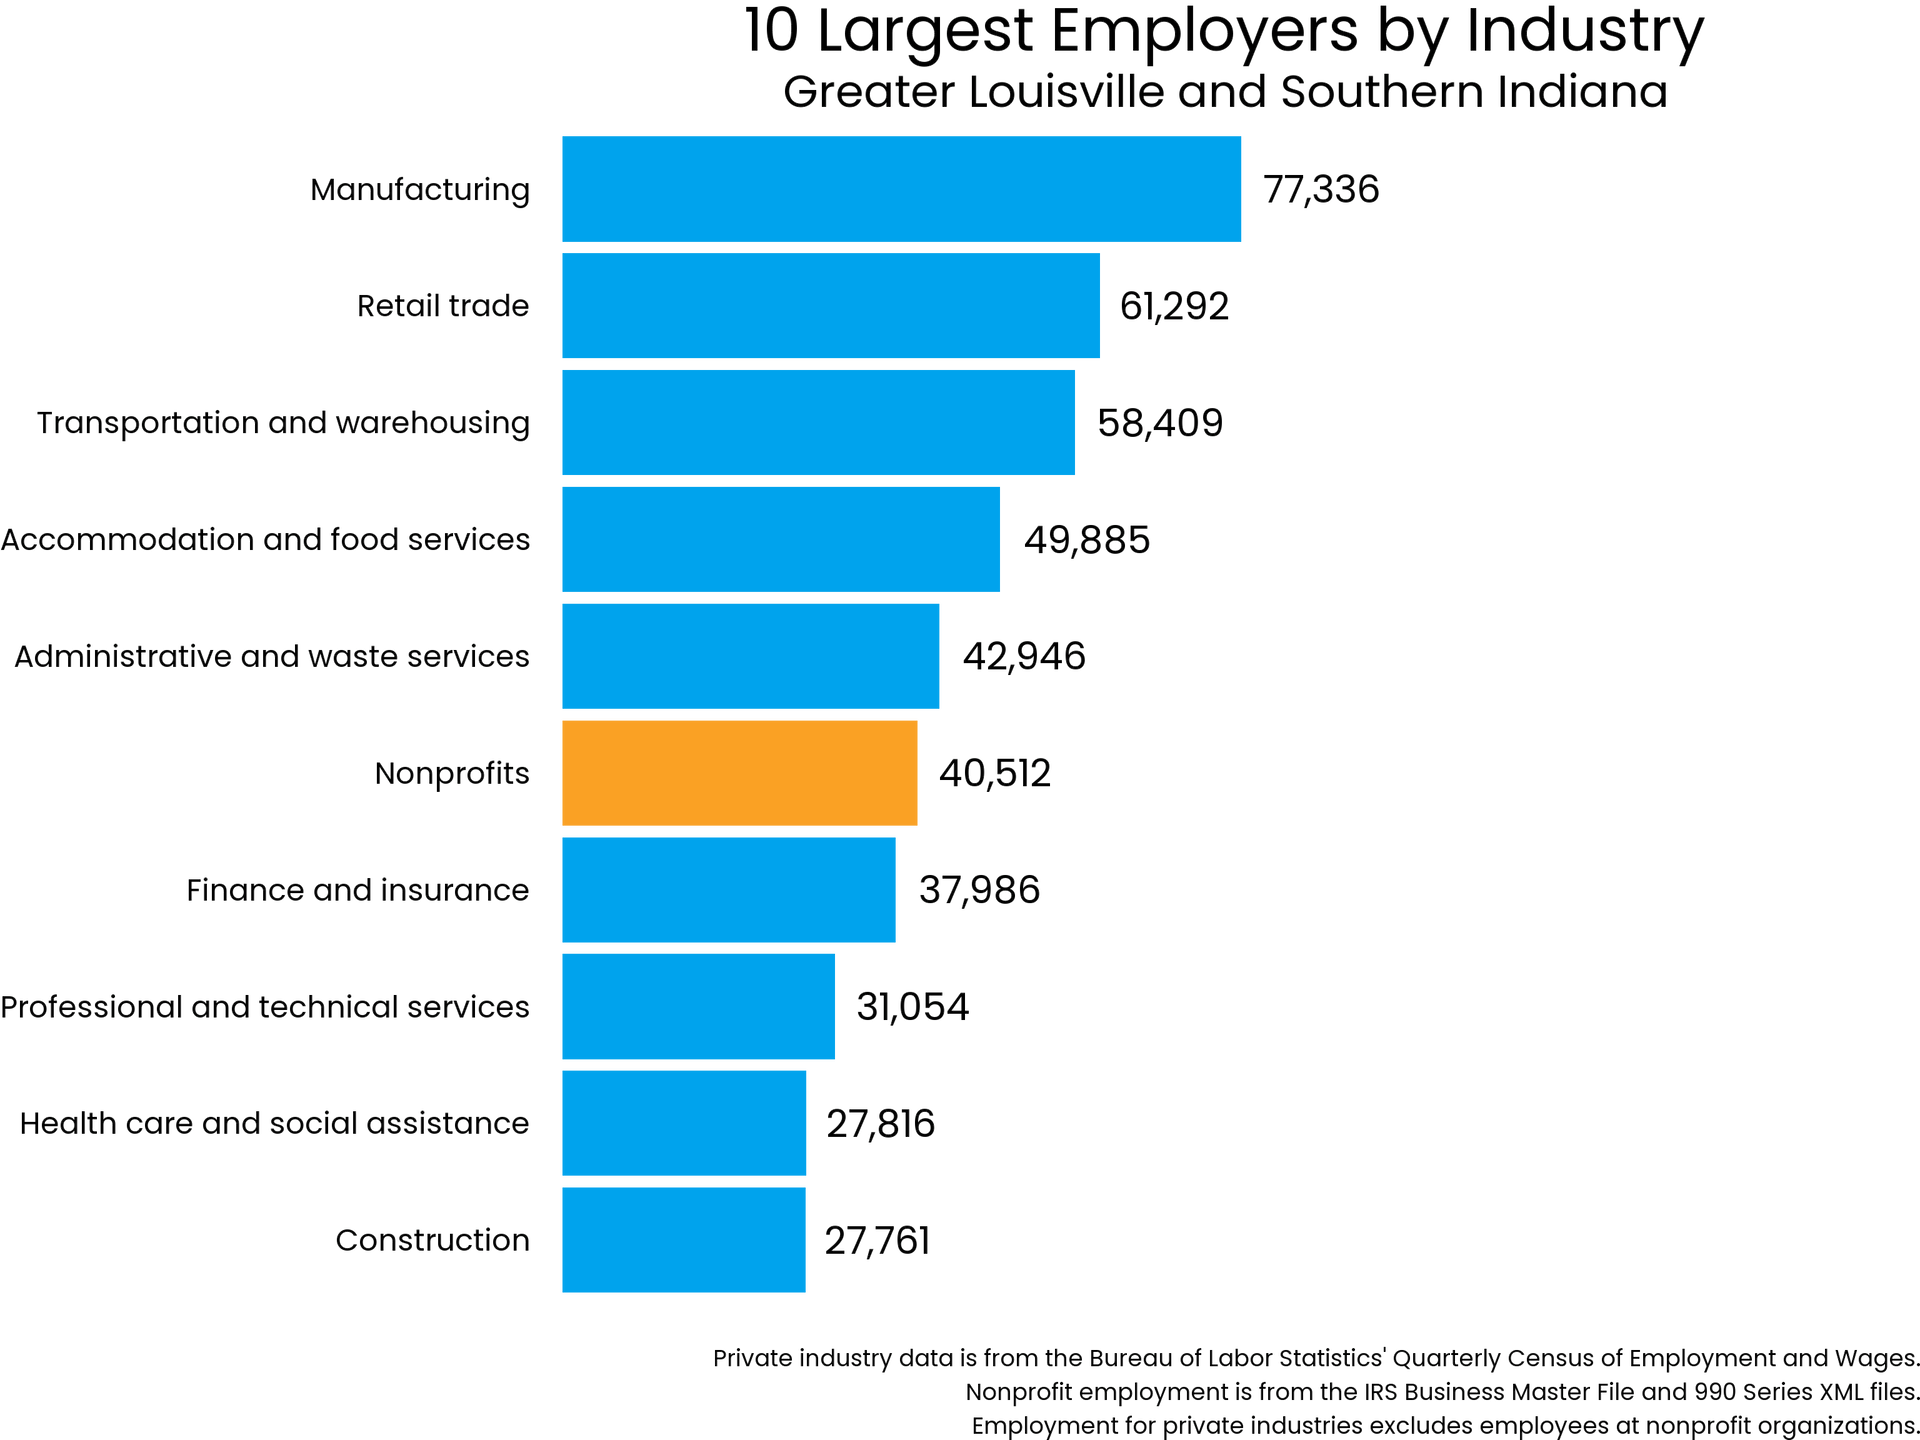
Nonprofits organizations employ more than 40,000 people in the 10-county region, but their economic power is especially strong in Jefferson County. The sector employs 37,000 people in Jefferson County alone, meaning that many households depend on these organizations for their livelihood. In the private sector, only manufacturing, retail, and logistics (transportation and warehousing) employ more people.
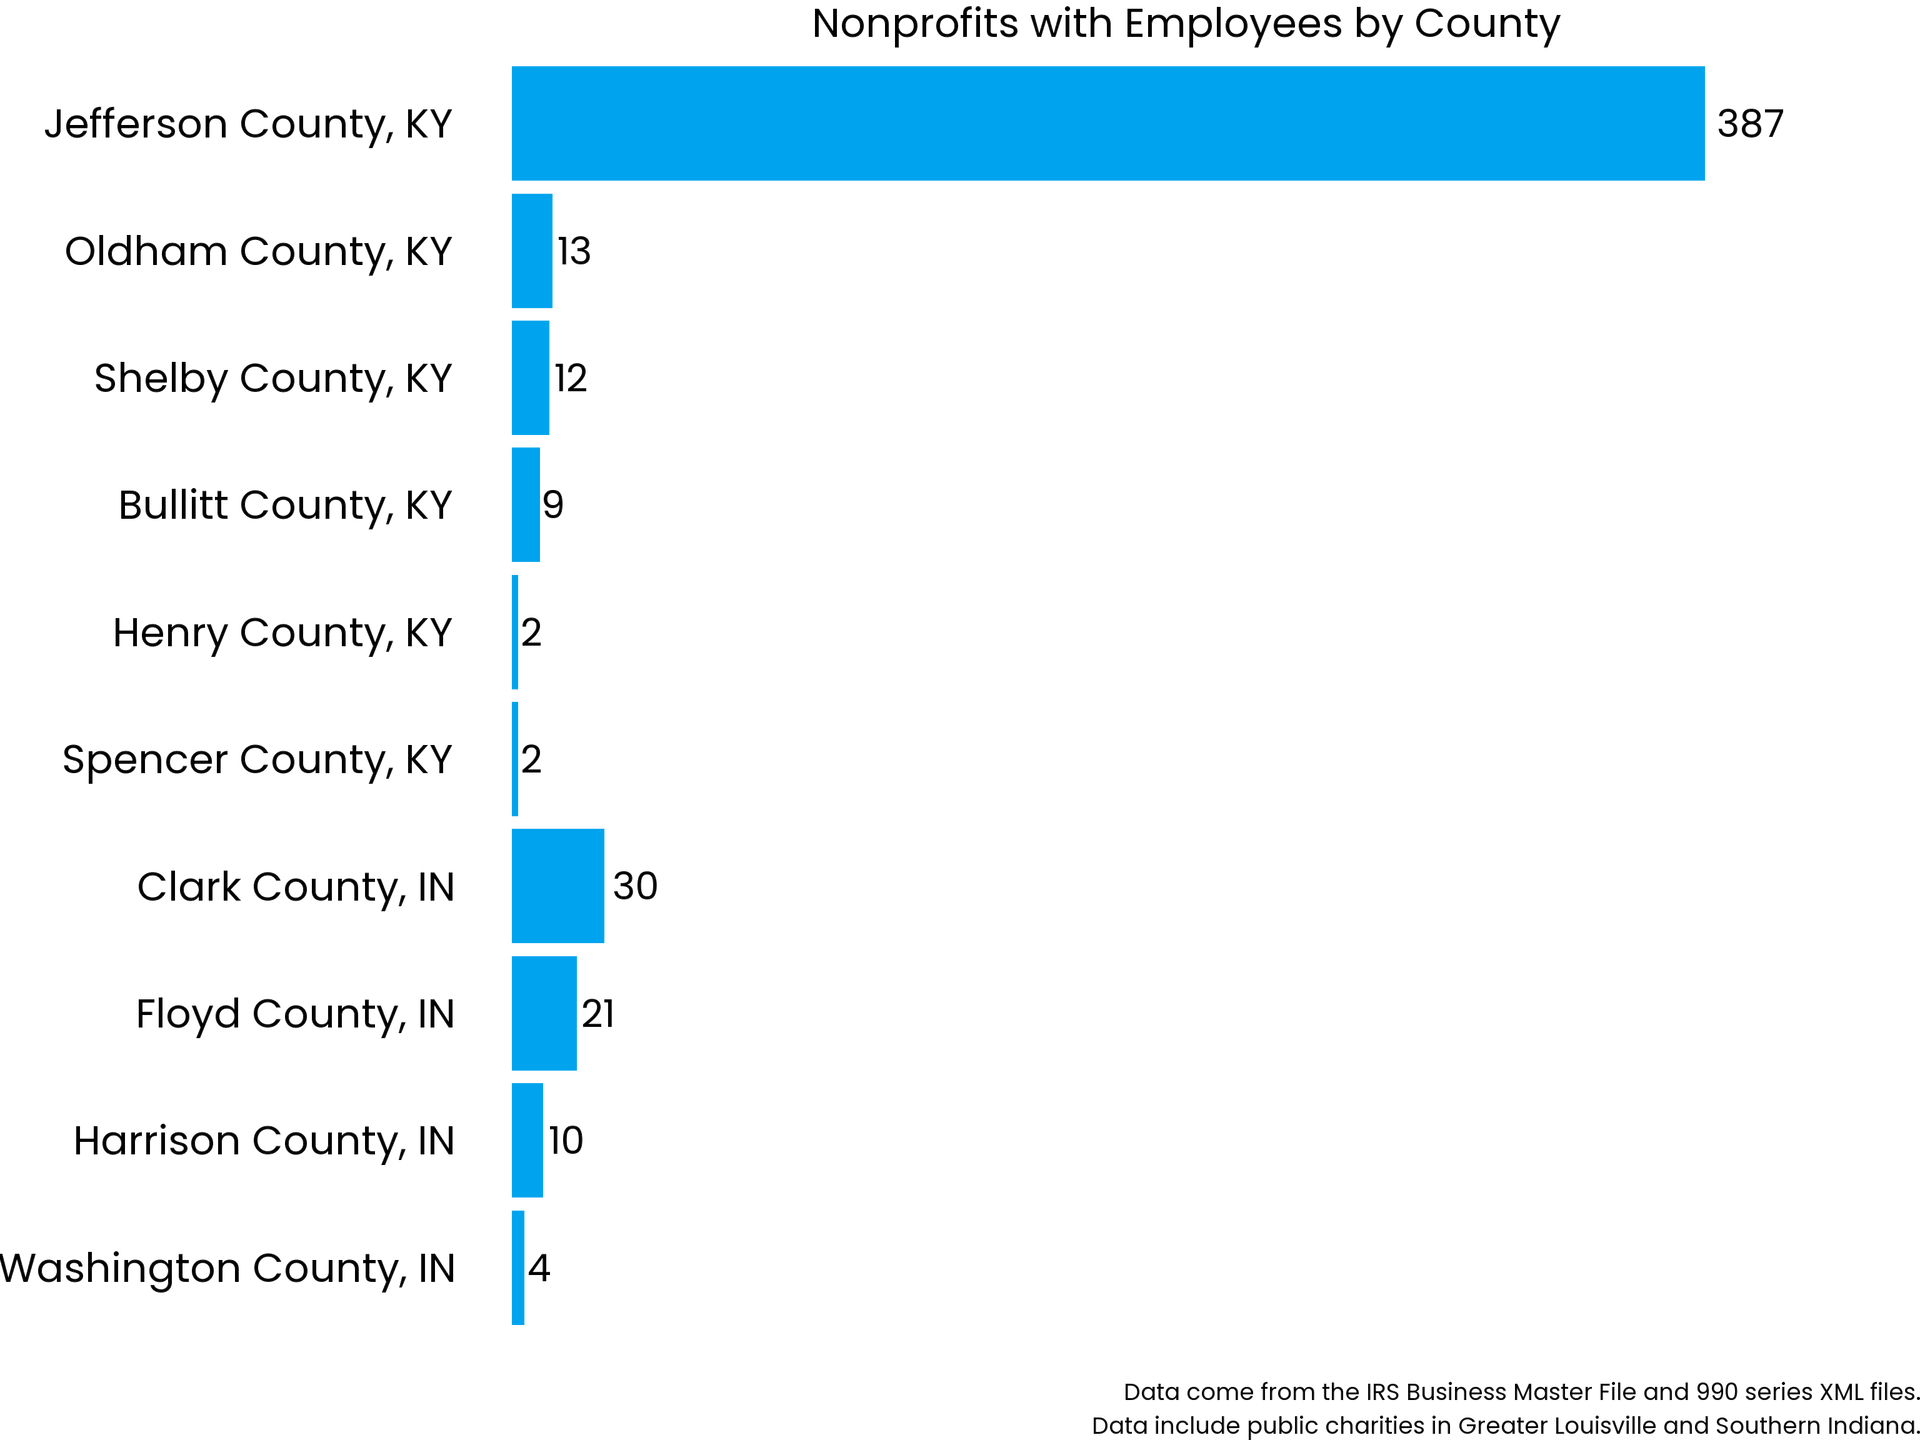
Where are the nonprofit jobs in the region?
People cross county lines and state lines when seeking employment – so there is a limit to how much can be gleaned from county-level data. People may live in Washington County, Indiana, and work in Jefferson County, Kentucky – and vice versa. These lines may become even blurrier in a hybrid work world. But in this data, jobs are counted in the county where the headquarters of the organization is.
Some types of nonprofit jobs may serve a region while being centrally located in the heart of Louisville – such as health care services and museums or other arts or cultural organizations. Others, like food pantries and after school programs, need to be located “close to home” – near the people who need them.
It is nevertheless instructive to note the distribution of nonprofit employment and the way it touches every county.
In the map on this page, Jefferson County has by far the largest number of nonprofit employees and. In the chart at bottom left, we see that it also has the largest payroll to go along with it.
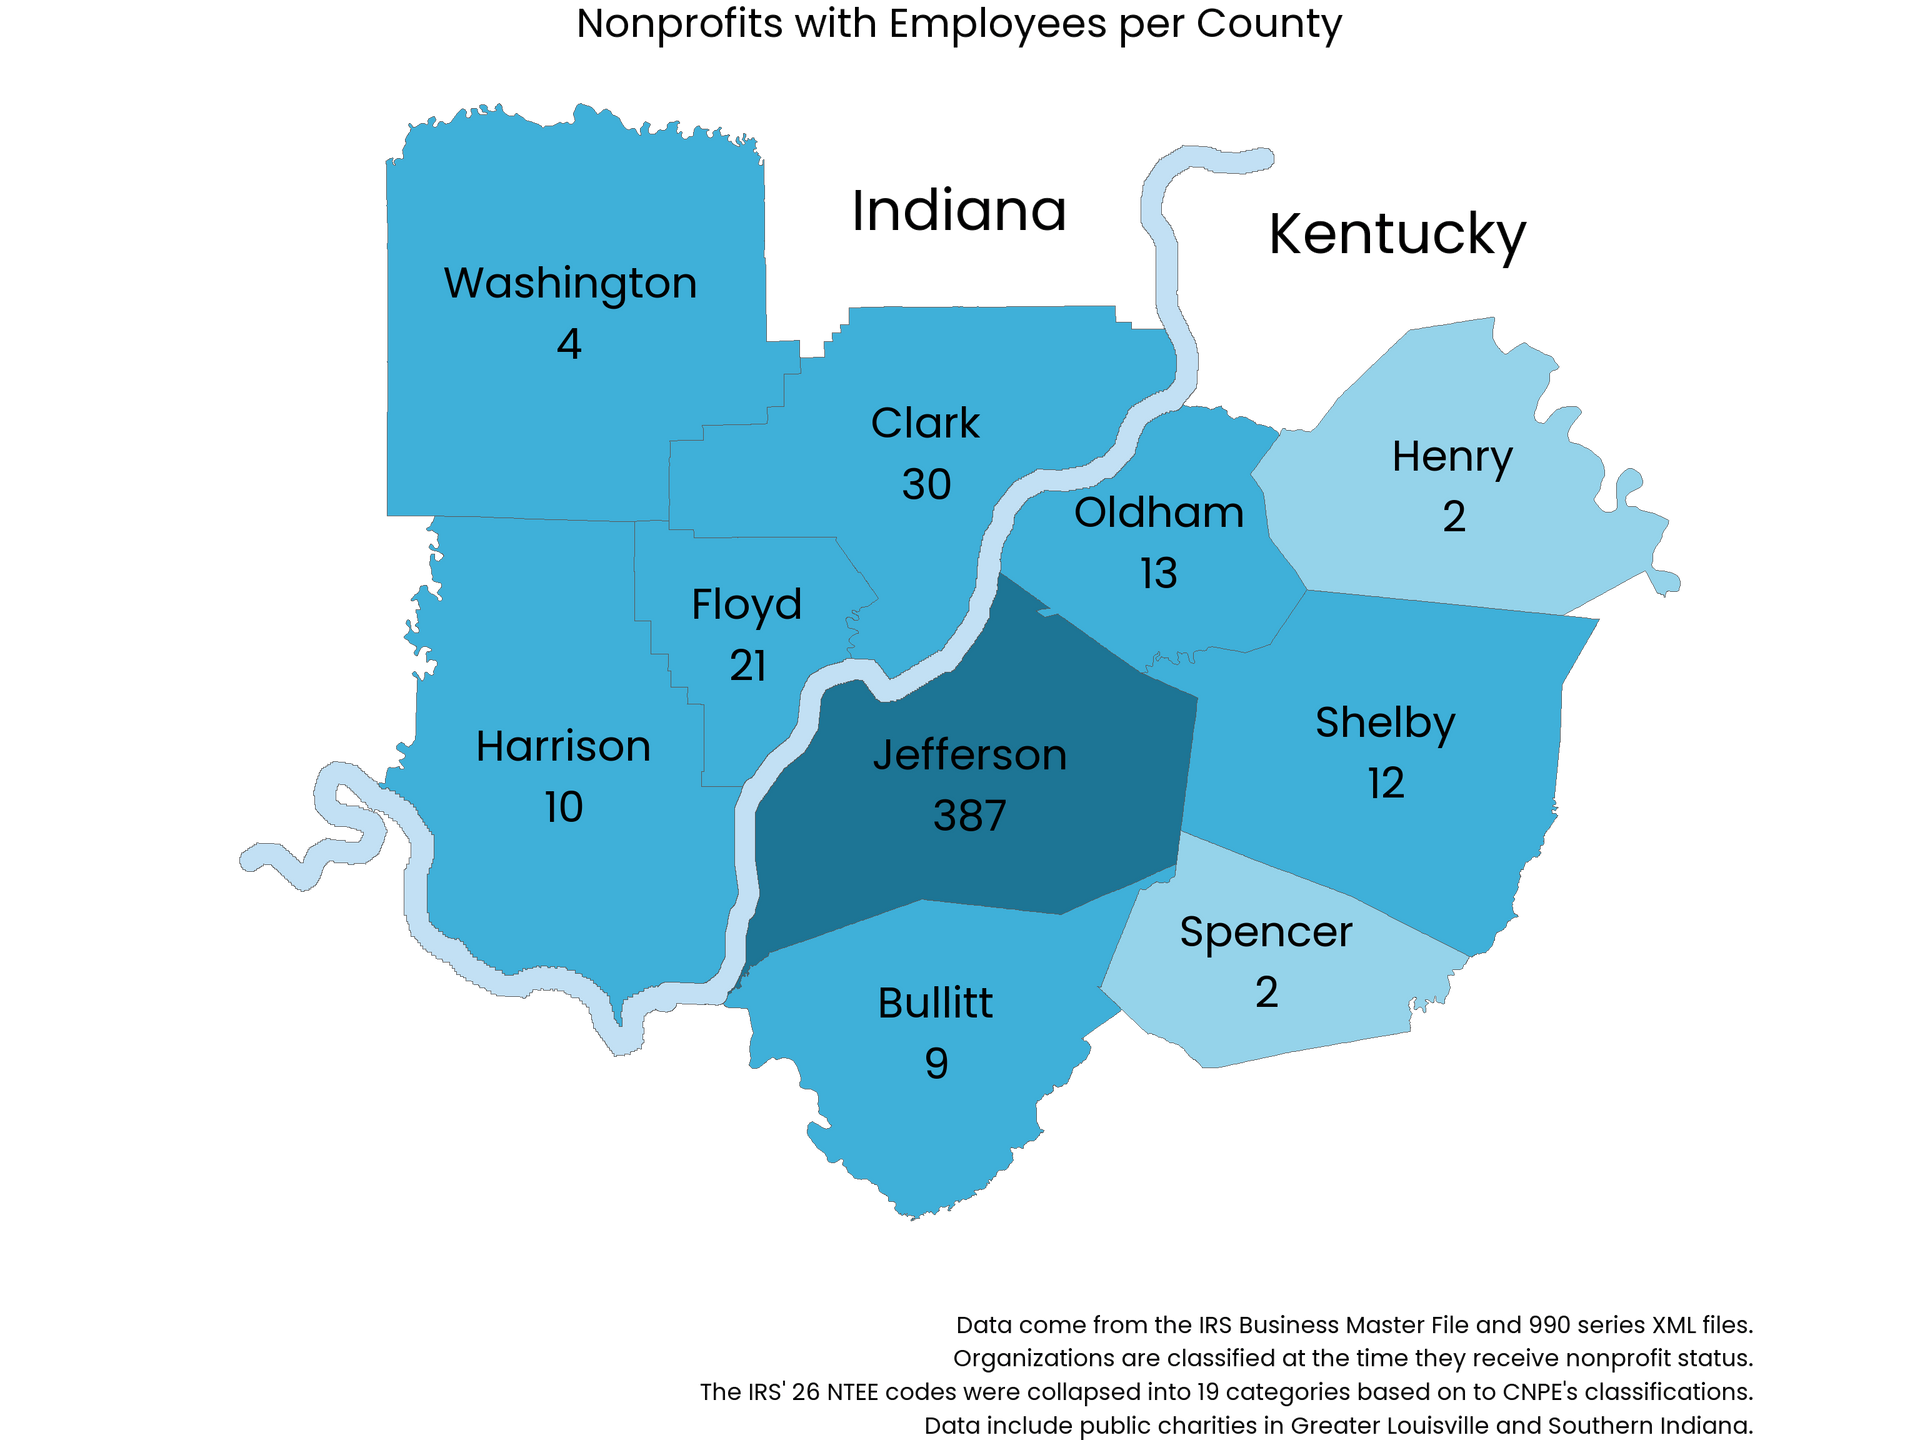
Even in smaller counties, the impact of nonprofit employment can be significant. Consider Shelby County, where there are 12 nonprofit organizations with employees. Those 12 organizations employ 166 people with a payroll of $2.6 million – representing a significant economic impact in a community of 50,000 people.

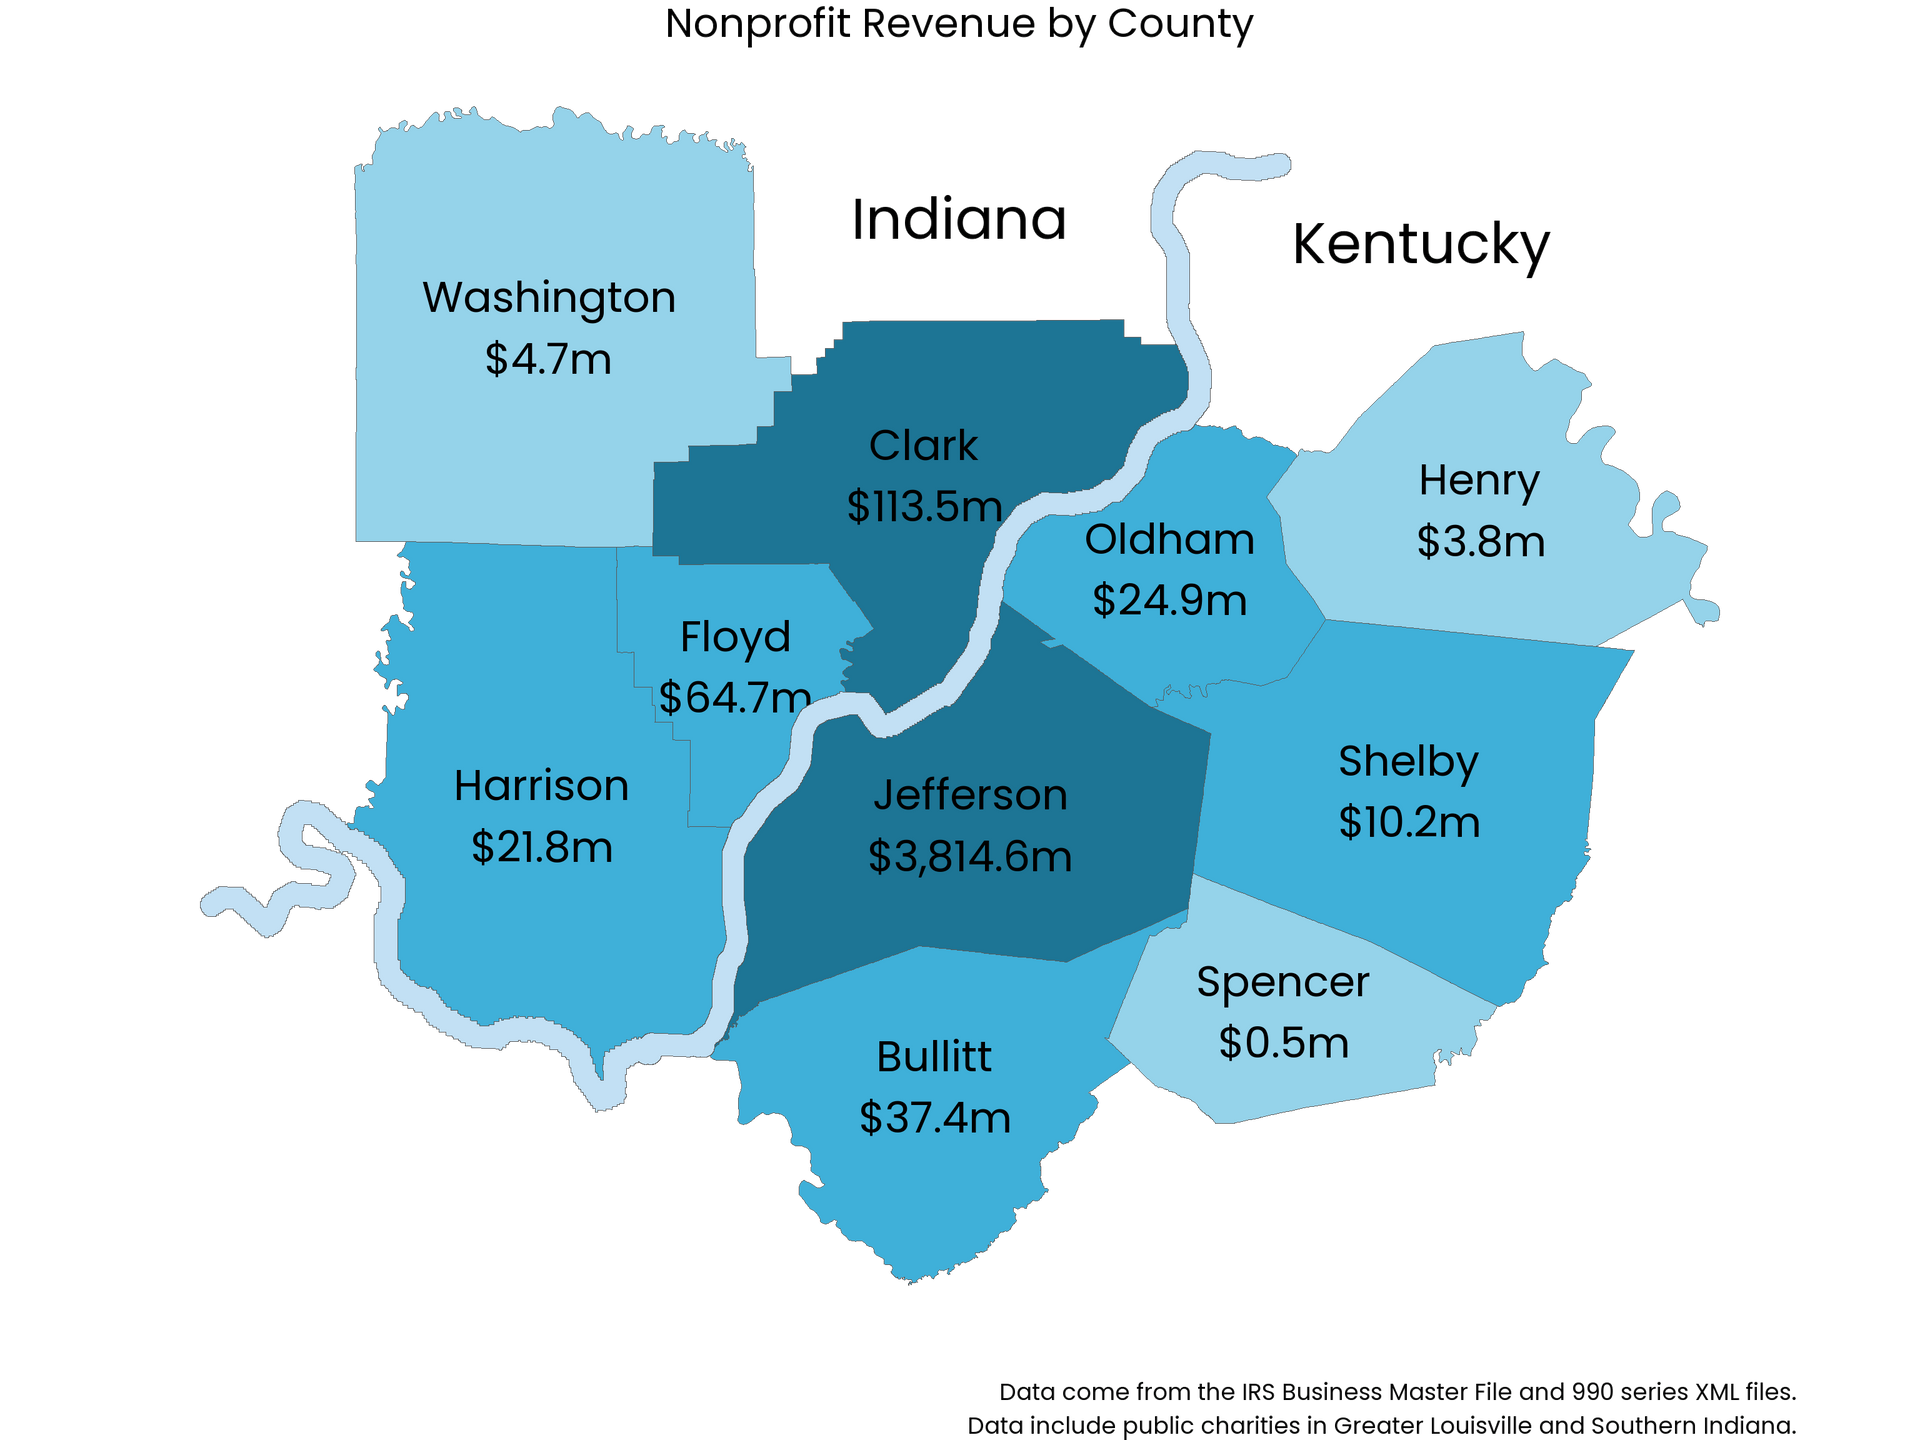
Economic impact as measured by revenue
Another way to measure the economic effect of the nonprofit sector is by its revenue. Most nonprofit organizations will spend nearly all of what they receive in any given year on payroll, equipment, and direct services to the public.
Nonprofit organizations, like any other organization, sometimes need services or goods provided from outside our community – online software for example. But much of the revenue will be spent locally.
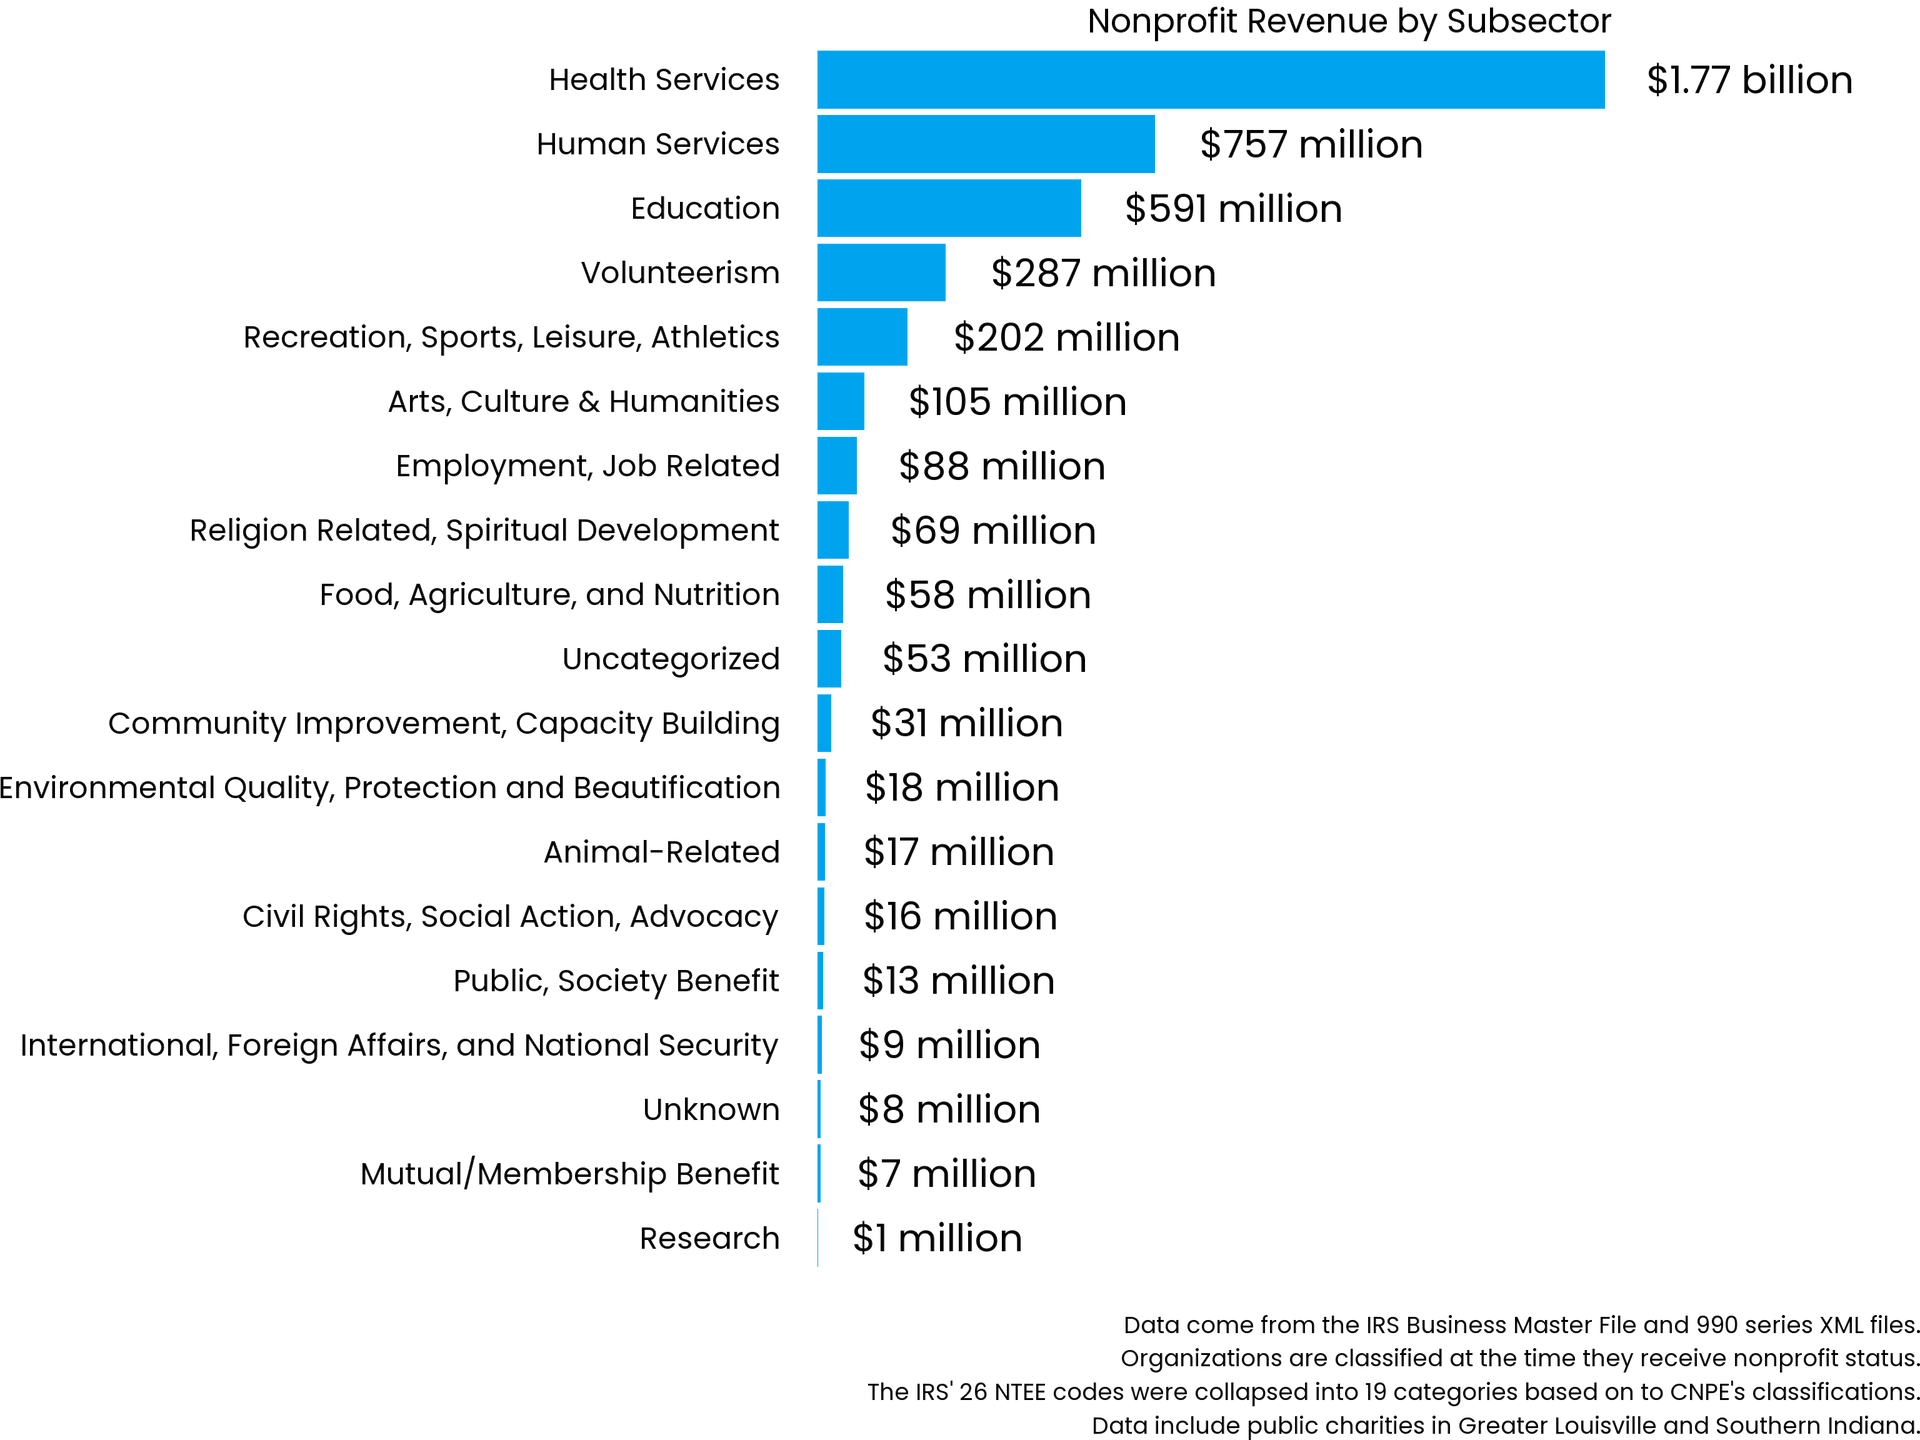
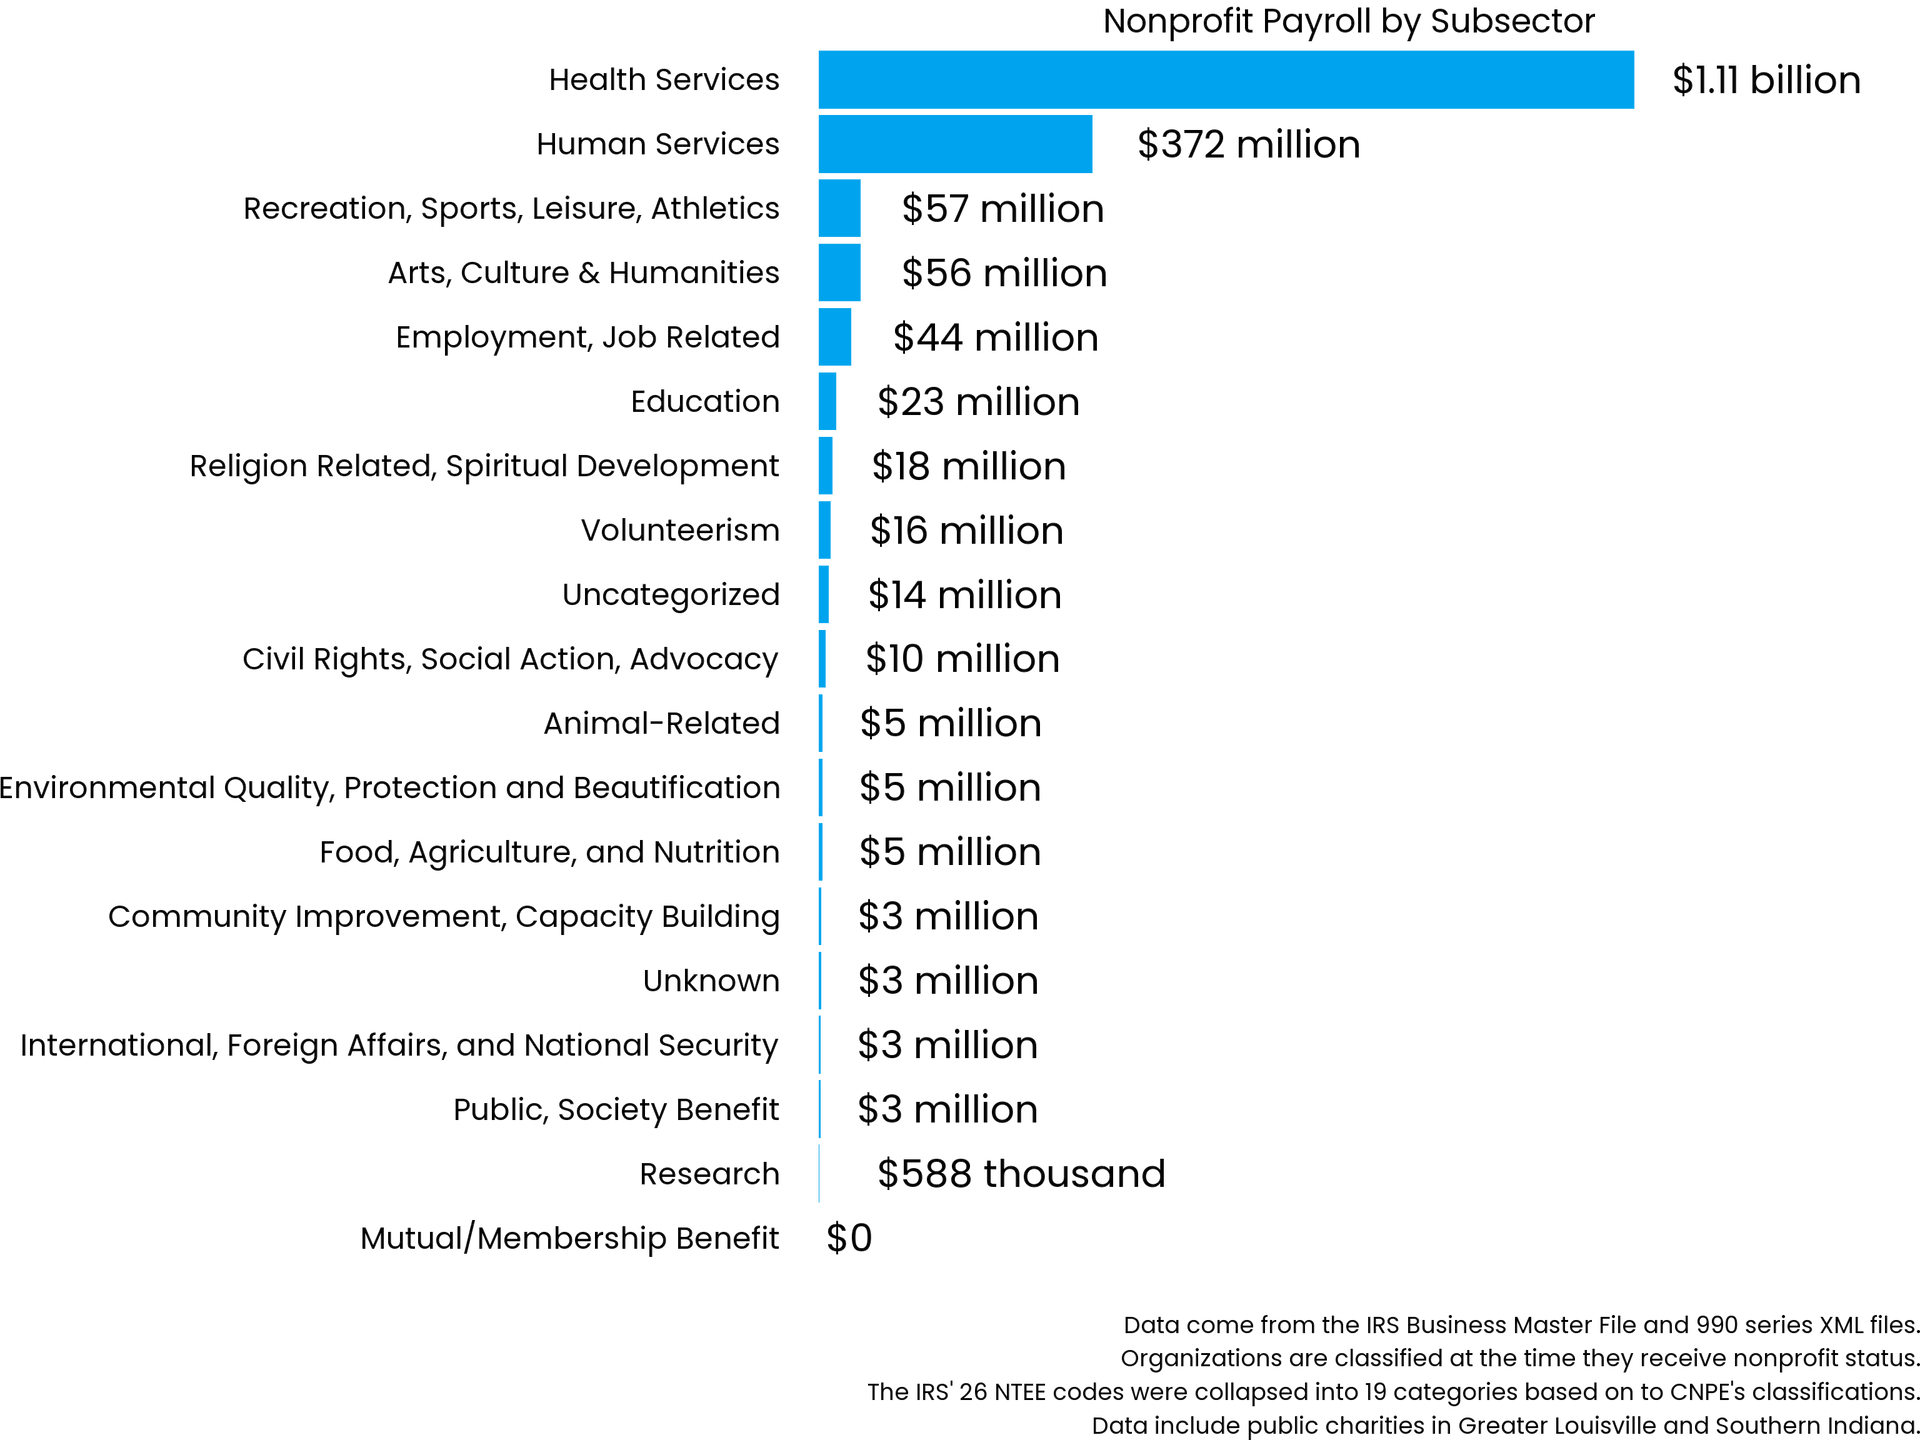
Subsectors and their economic impact: Measured by employees, payroll, and revenue
Not all nonprofit subsectors have an equal influence on the local economy. As with any economic sector, the number of employees and the size of the payroll is determined by a variety of economic factors with organizations relying on highly skilled health care professionals typically paying more, as one example. Employees in the health services subsector average more than $70,000 per year.
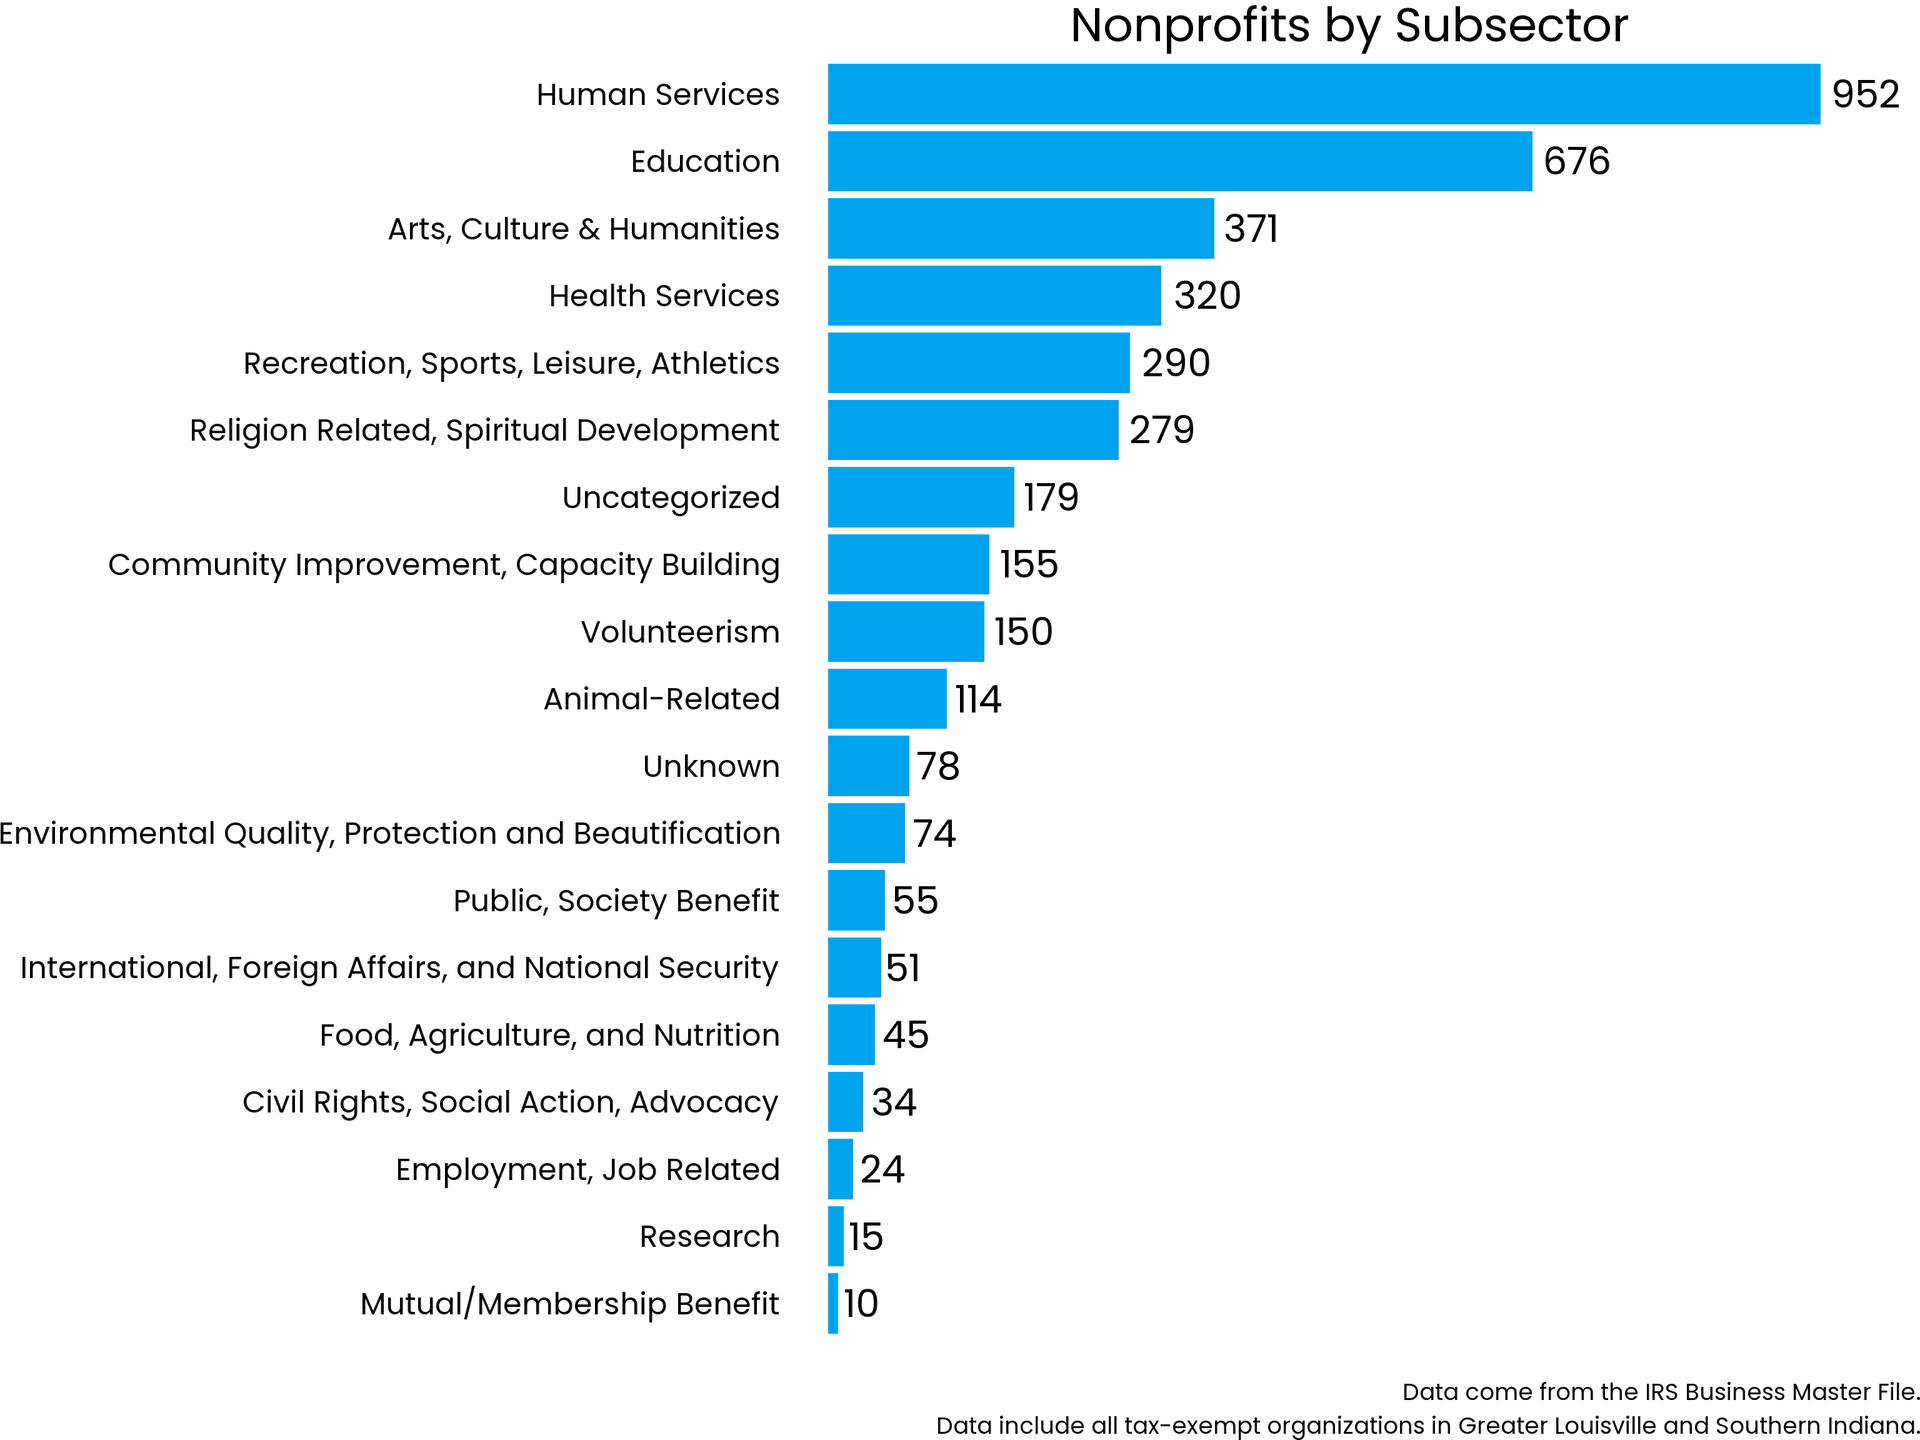
Subsectors with the most revenue
Looking at the revenue by sector helps us gauge the size and relative scope of the various subsectors. About half the subsectors have – in total for the entire subsector – less than $20 million in revenue.
Subsectors with the highest payroll
It’s not surprising that the health services subsector has the highest payroll with both the most employees and many highly skilled employees. But it’s interesting to see that even subsectors that are not thought of as “high-paying“ professions make a significant contribution to the local economy through payroll – with $363 million in human services, $57 million in recreation and sports and $56 million in arts and culture.
A note from CNPE: We need to watch wage trends carefully. In the past two years, there has been economic pressure toward higher wages in the face of a labor shortage. This has especially affected retail jobs…and some nonprofit organization leaders say they are now struggling to compete with retail jobs when hiring some workers. That may result in higher wages for some nonprofit employees. CNPE advocates for paying market rates – but recognizes that will also require more revenue for nonprofit organizations.
UNDERSTANDING THE FUNDING ENVIRONMENT
____
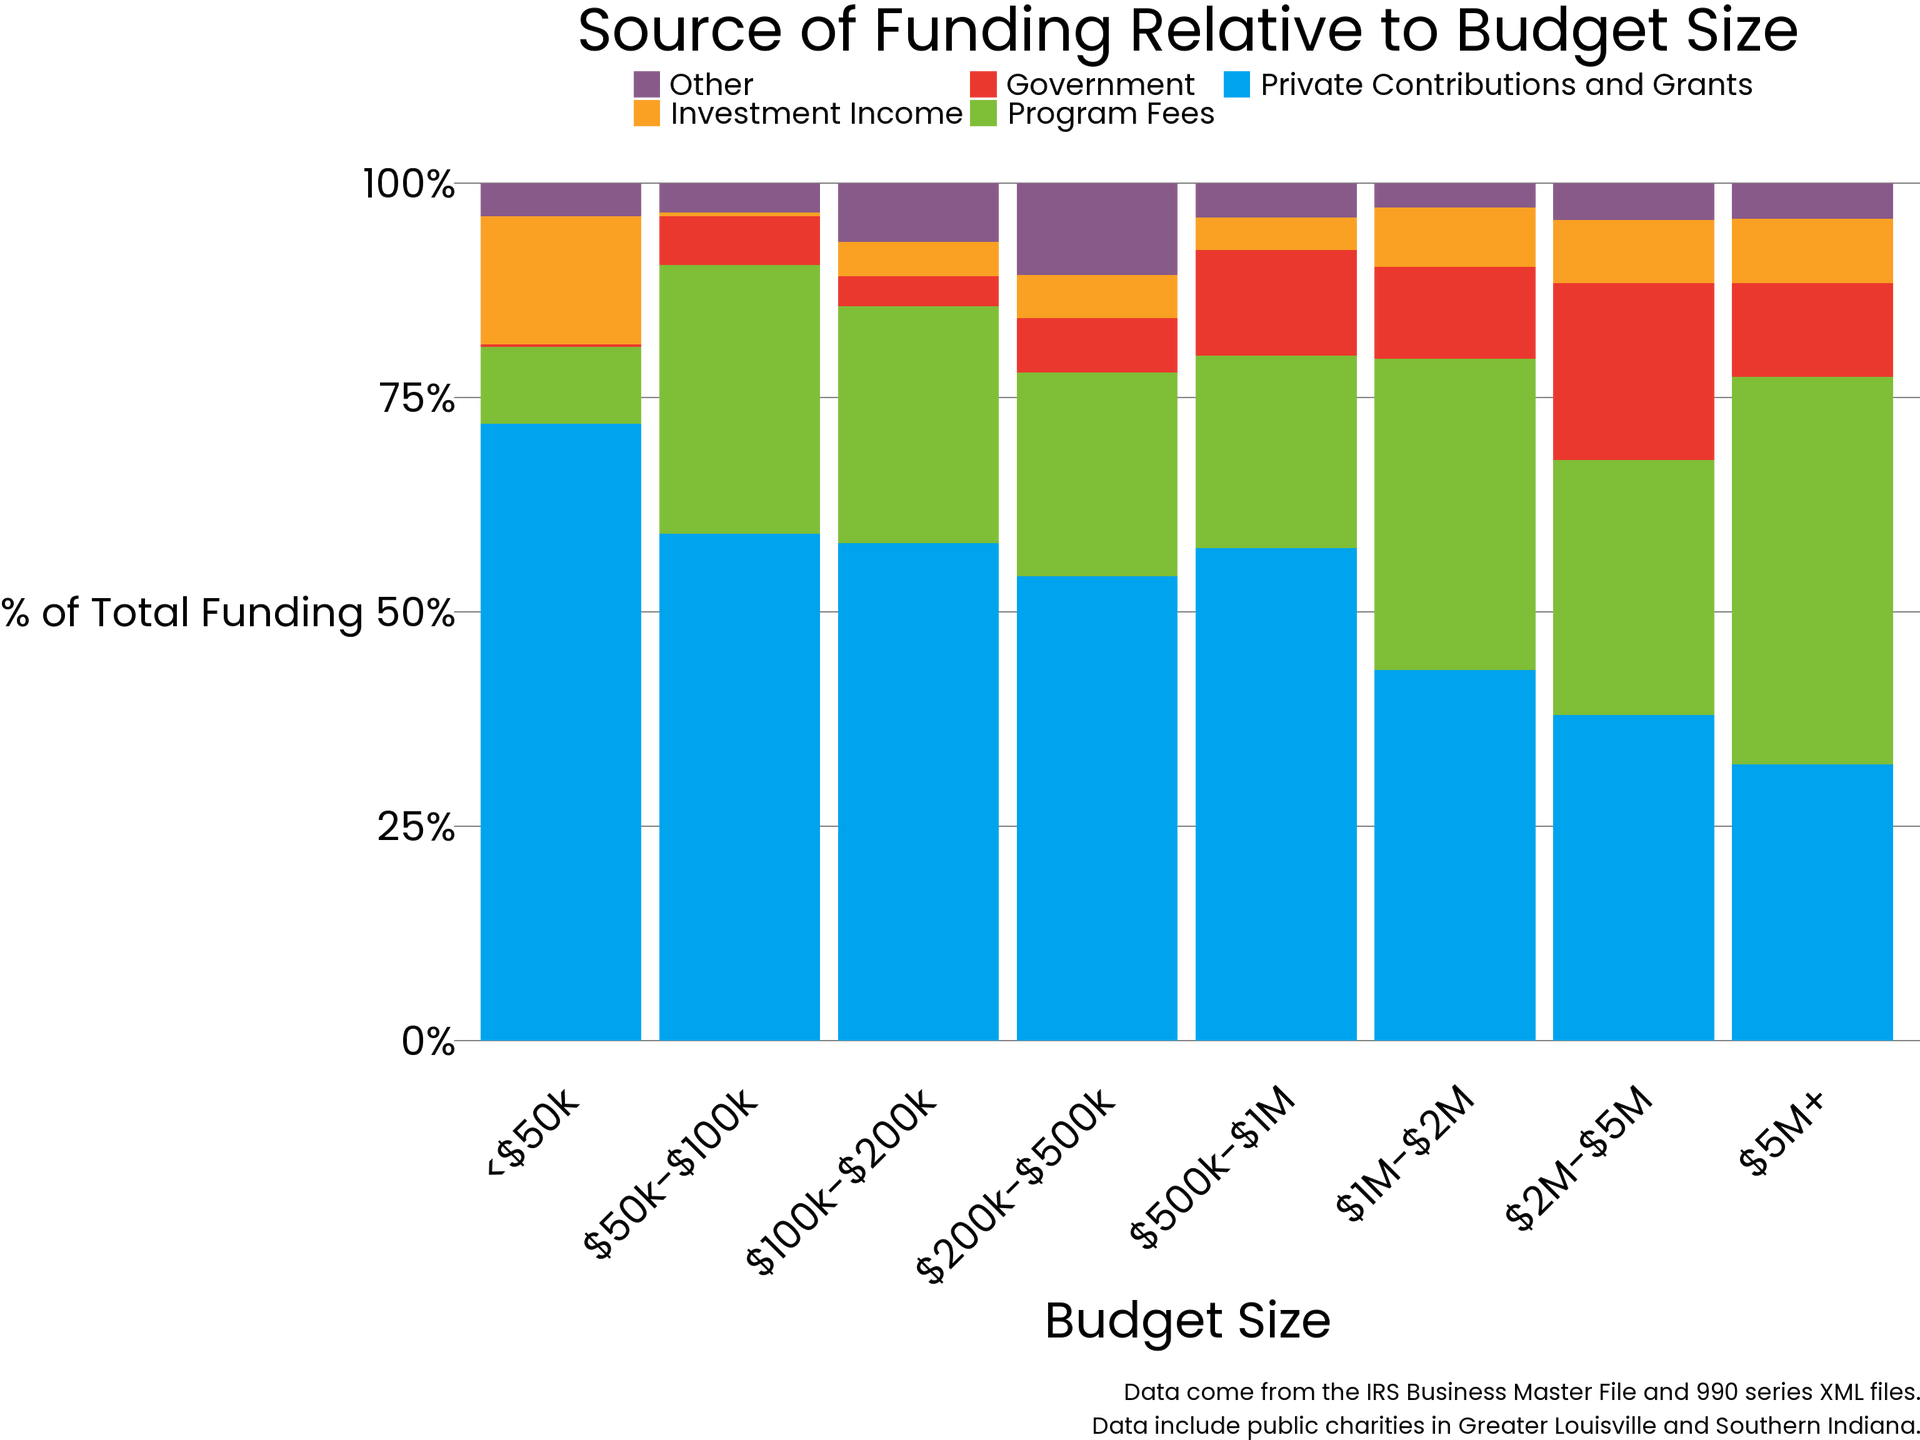
Across sectors, the largest category of funding is individual donors. Those donors are proven champions who may represent our greatest opportunity for growth.
Most nonprofit organizations get the majority of their support from private contributions and grants – the blue area on this accompanying chart. Program fees are often the second largest type of support – they can be a significant area of potential growth because those fees are often completely within the control of the organization. However, many nonprofit organizations have justifiable equity concerns about pricing their programs in a way that is out of the reach of people who need them the most.
Corporate sponsorships are one subset of private contributions that can increase revenue. Nonprofits need to examine the value of sponsorships and ensure they are maximizing their revenue.
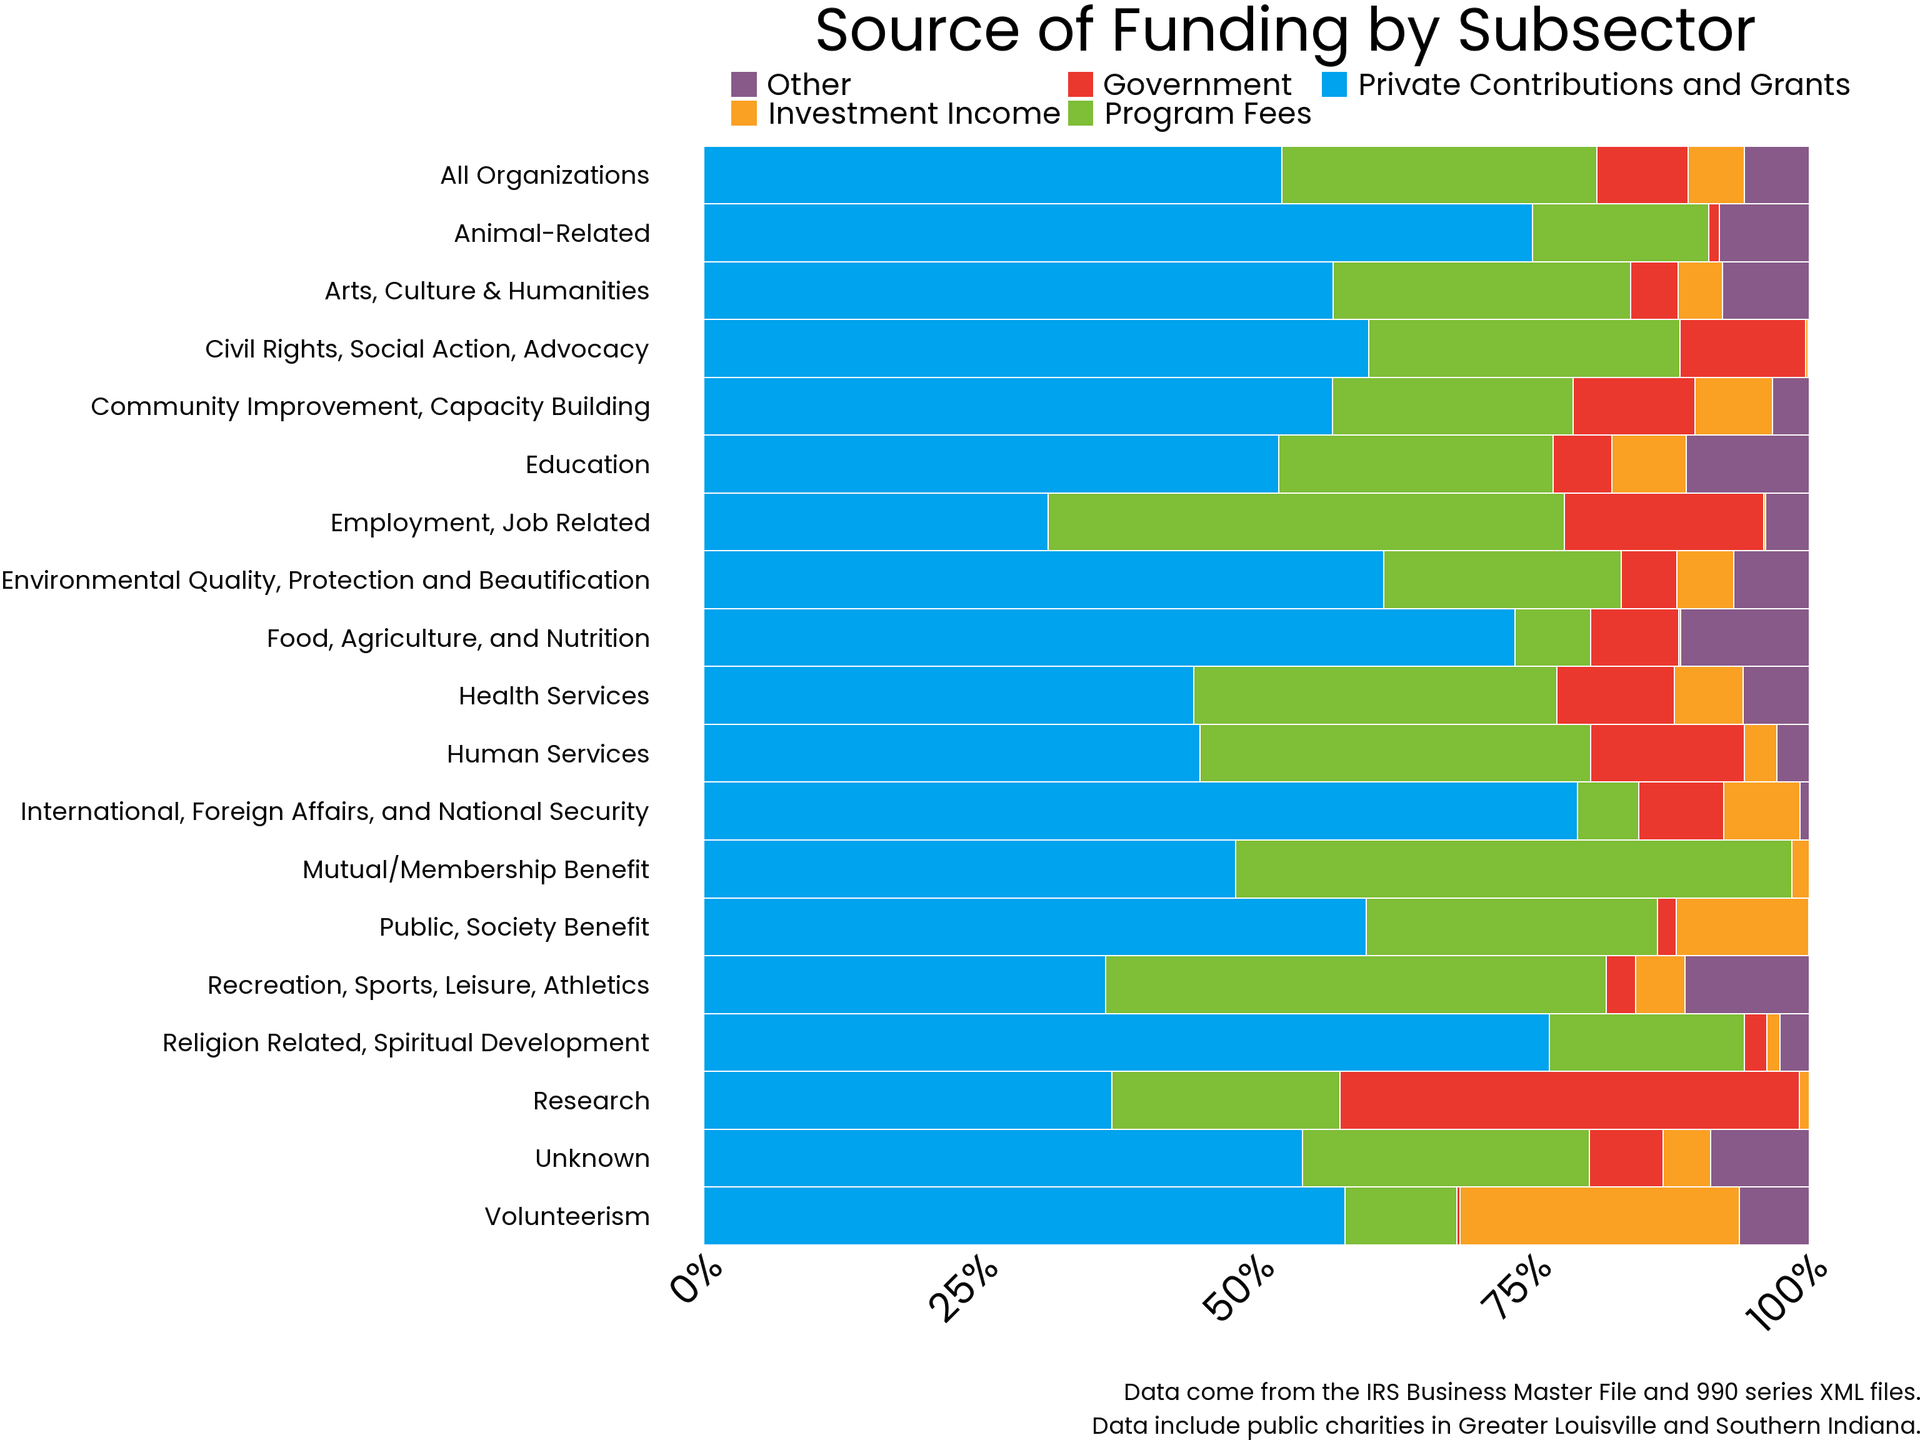
Smaller nonprofit organizations in our area typically do not get much government support, which is shown in red. Revenue from government does not become significant until budget sizes approach $1 million. Government support is most significant for organizations with budgets between $2 and $5 million. Most government funding goes to housing and human services nonprofits to cover fees for service.
This raises equity questions if some organizations tend to be small and have lower budgets. There can also be a negative cycle when it comes to funding. Organizations with limited funds have limited ability to measure their impact – which makes it hard for them to qualify for more funding.
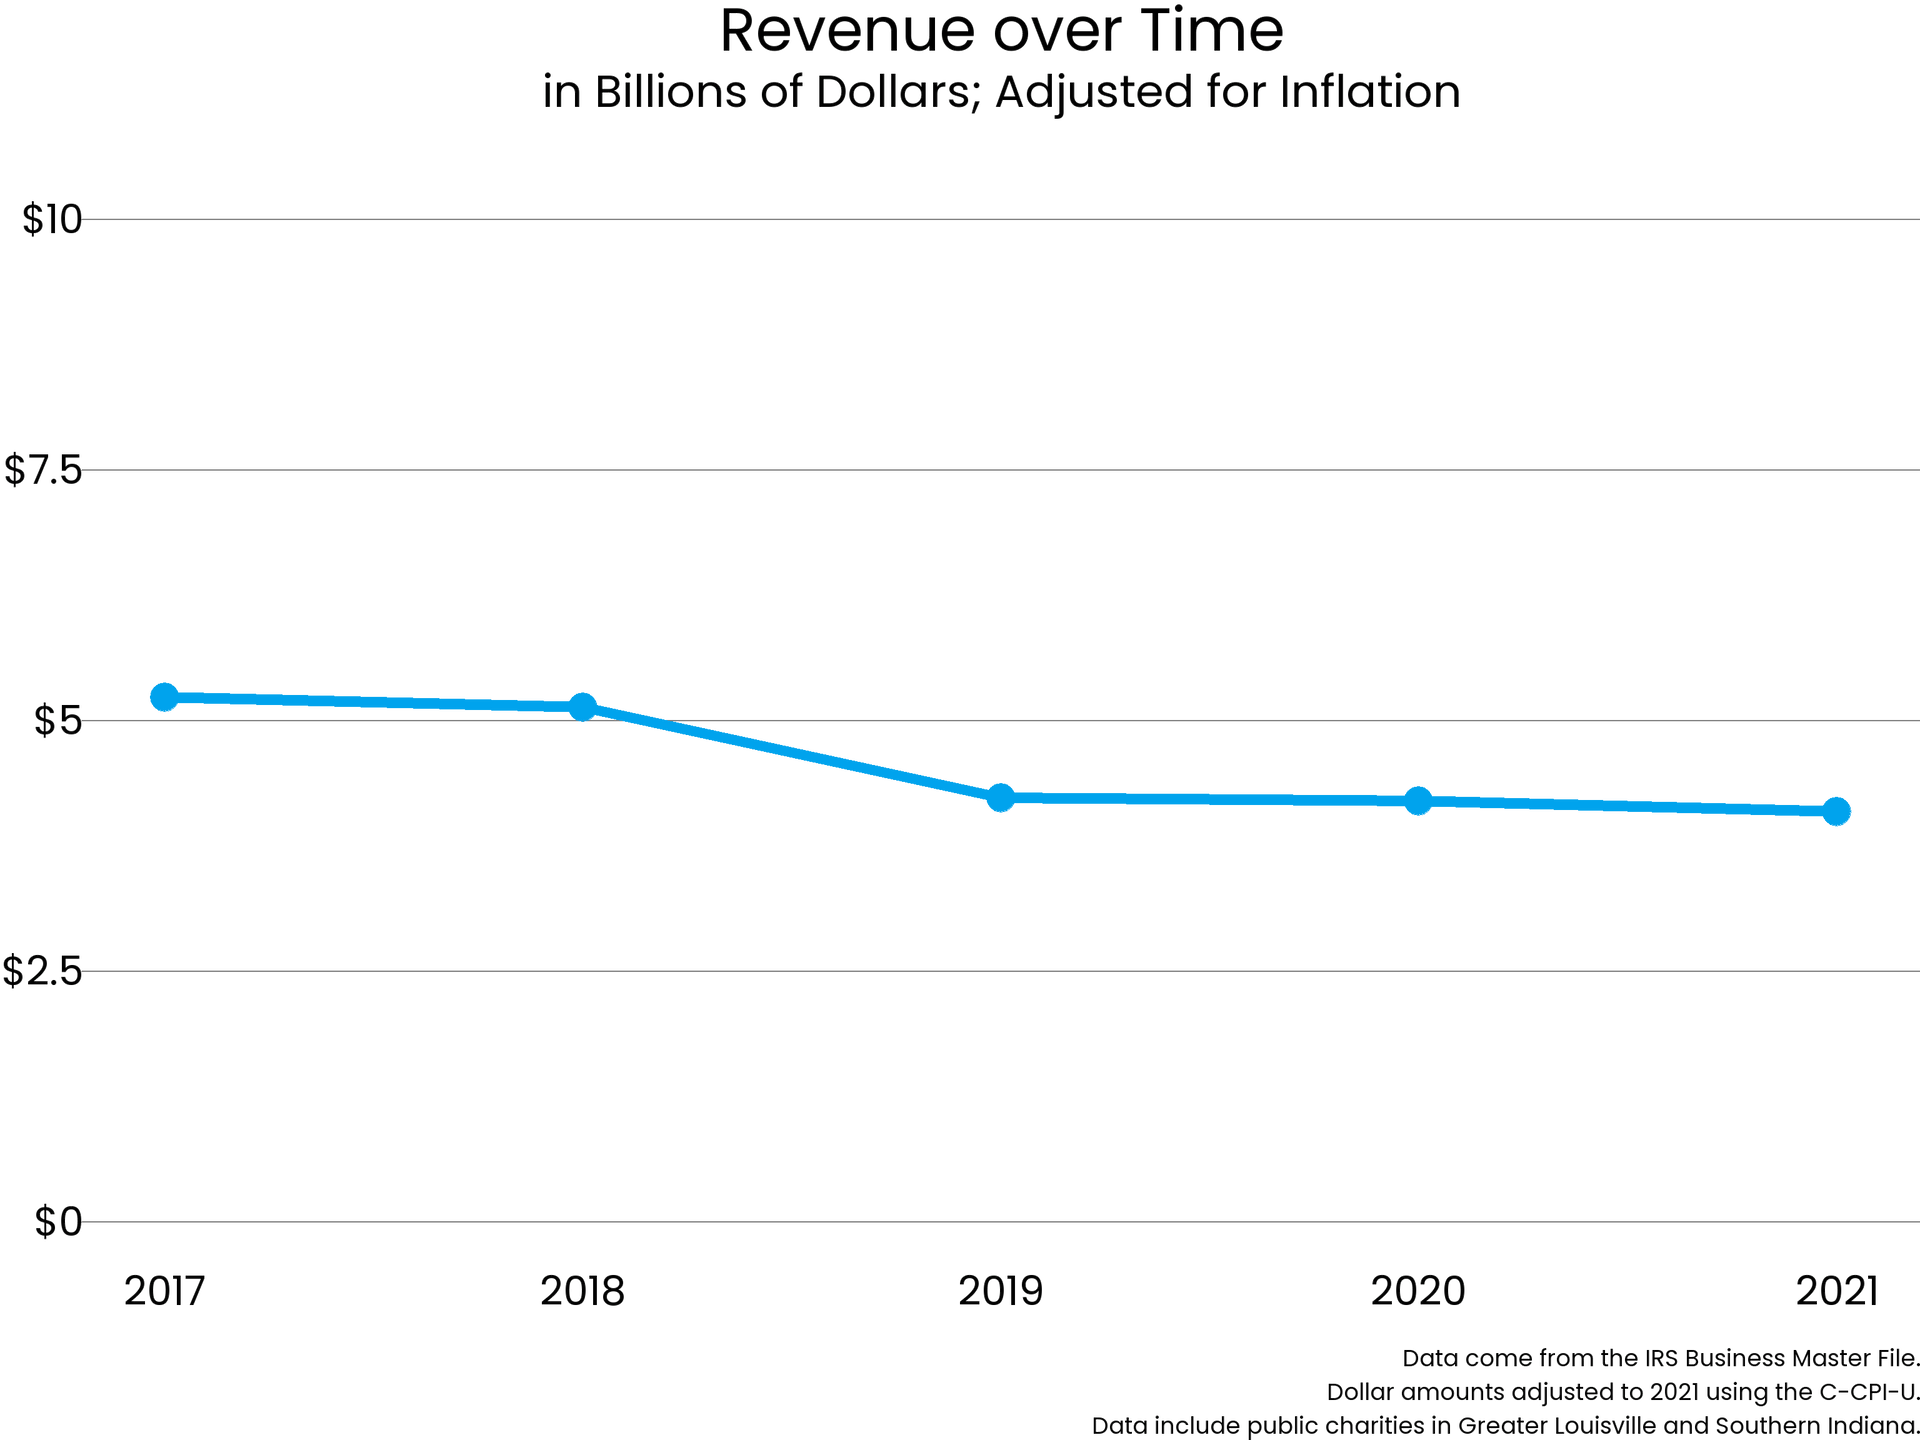
Nonprofits are an economic driver – but revenue is stagnant
Funding for nonprofit organizations struggles to keep pace with inflation.
Revenue is not keeping up with inflation. Why?
National headlines about giving offer conflicting reports about to what extent giving is growing.
Keep in mind that some of these stories may be based on surveys in which people self-report that they “gave” – but they may be reporting giving that isn’t to a nonprofit or even to a 501(c) organization. (For example, they may have given to an individual through a GoFundMe page.)
In addition, individuals can give more than last year, but not enough more to keep up with inflation. That’s what
Giving USA said happened in 2021. That report also showed corporate giving was up significantly that year – but it’s unclear if that trend will continue or was motivated in part by pandemic responses.
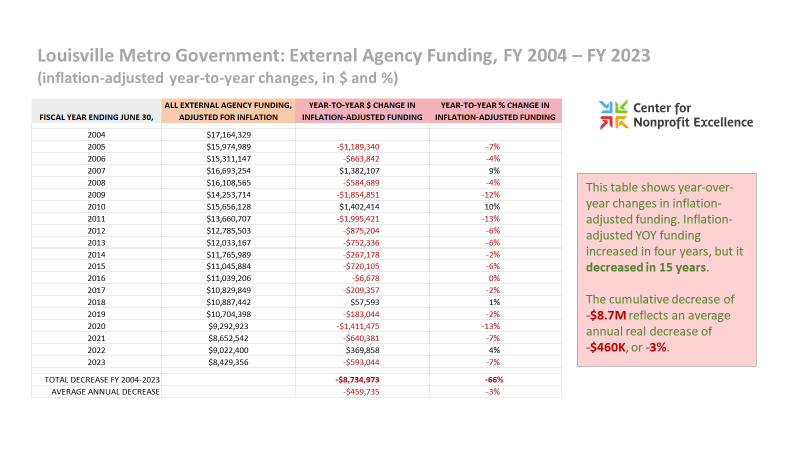
Louisville Metro funding has declined when adjusted for inflation
Historically, local government in Louisville has had a role in funding nonprofit organizations, recognizing that these organizations often save the government money in the long run. For example, a substance abuse treatment center can prevent expensive jail sentences.
But in Louisville Metro the only jurisdiction for which we looked at detailed data - government support has not kept up with inflation. When adjusted for inflation, this difference is stark: a 66% decrease in external agency grant funding over the past 20 years. During that same time period, Louisville Metro’s population grew by more than 10%.
Meanwhile, in more recent years, Louisville has:
- faced a global pandemic that caused significant workforce disruptions, resulting in learning challenges at schools, and created social isolation and mental health challenges for many;
- confronted serious issues of racial inequity, with the nation’s eyes on us after the killing of Breonna Taylor; and
- witnessed significant increases in violent crime.
Any of these bullet points could be used as an argument for greater investment in nonprofit organizations. People in Louisville Metro have lobbied the Kentucky General Assembly unsuccessfully for a local option sales tax that could generate more revenue for projects within the community.
When American Rescue Plan funding expires in 2025, some nonprofit organizations may face new challenges. What will happen to the services they are currently providing? Who will pay for them? How will their loss affect the community? Whose responsibility is it to meet these challenges?
Does our community have too many nonprofits?
____
At the Center for Nonprofit Excellence, we often hear people share their opinion that “Louisville has too many nonprofits.” Does it?
“Too many” is a qualitative assessment based on individual perceptions. It may reflect concerns about organizations with overlapping missions competing for the same grant money or public support. Or it may just reflect a weariness in receiving so many fundraising solicitations!
Data can’t define what constitutes “too few” or “too many” – but it can let us compare ourselves to peer cities. One data point to consider is whether we have more nonprofit organizations per capita than peer cities.
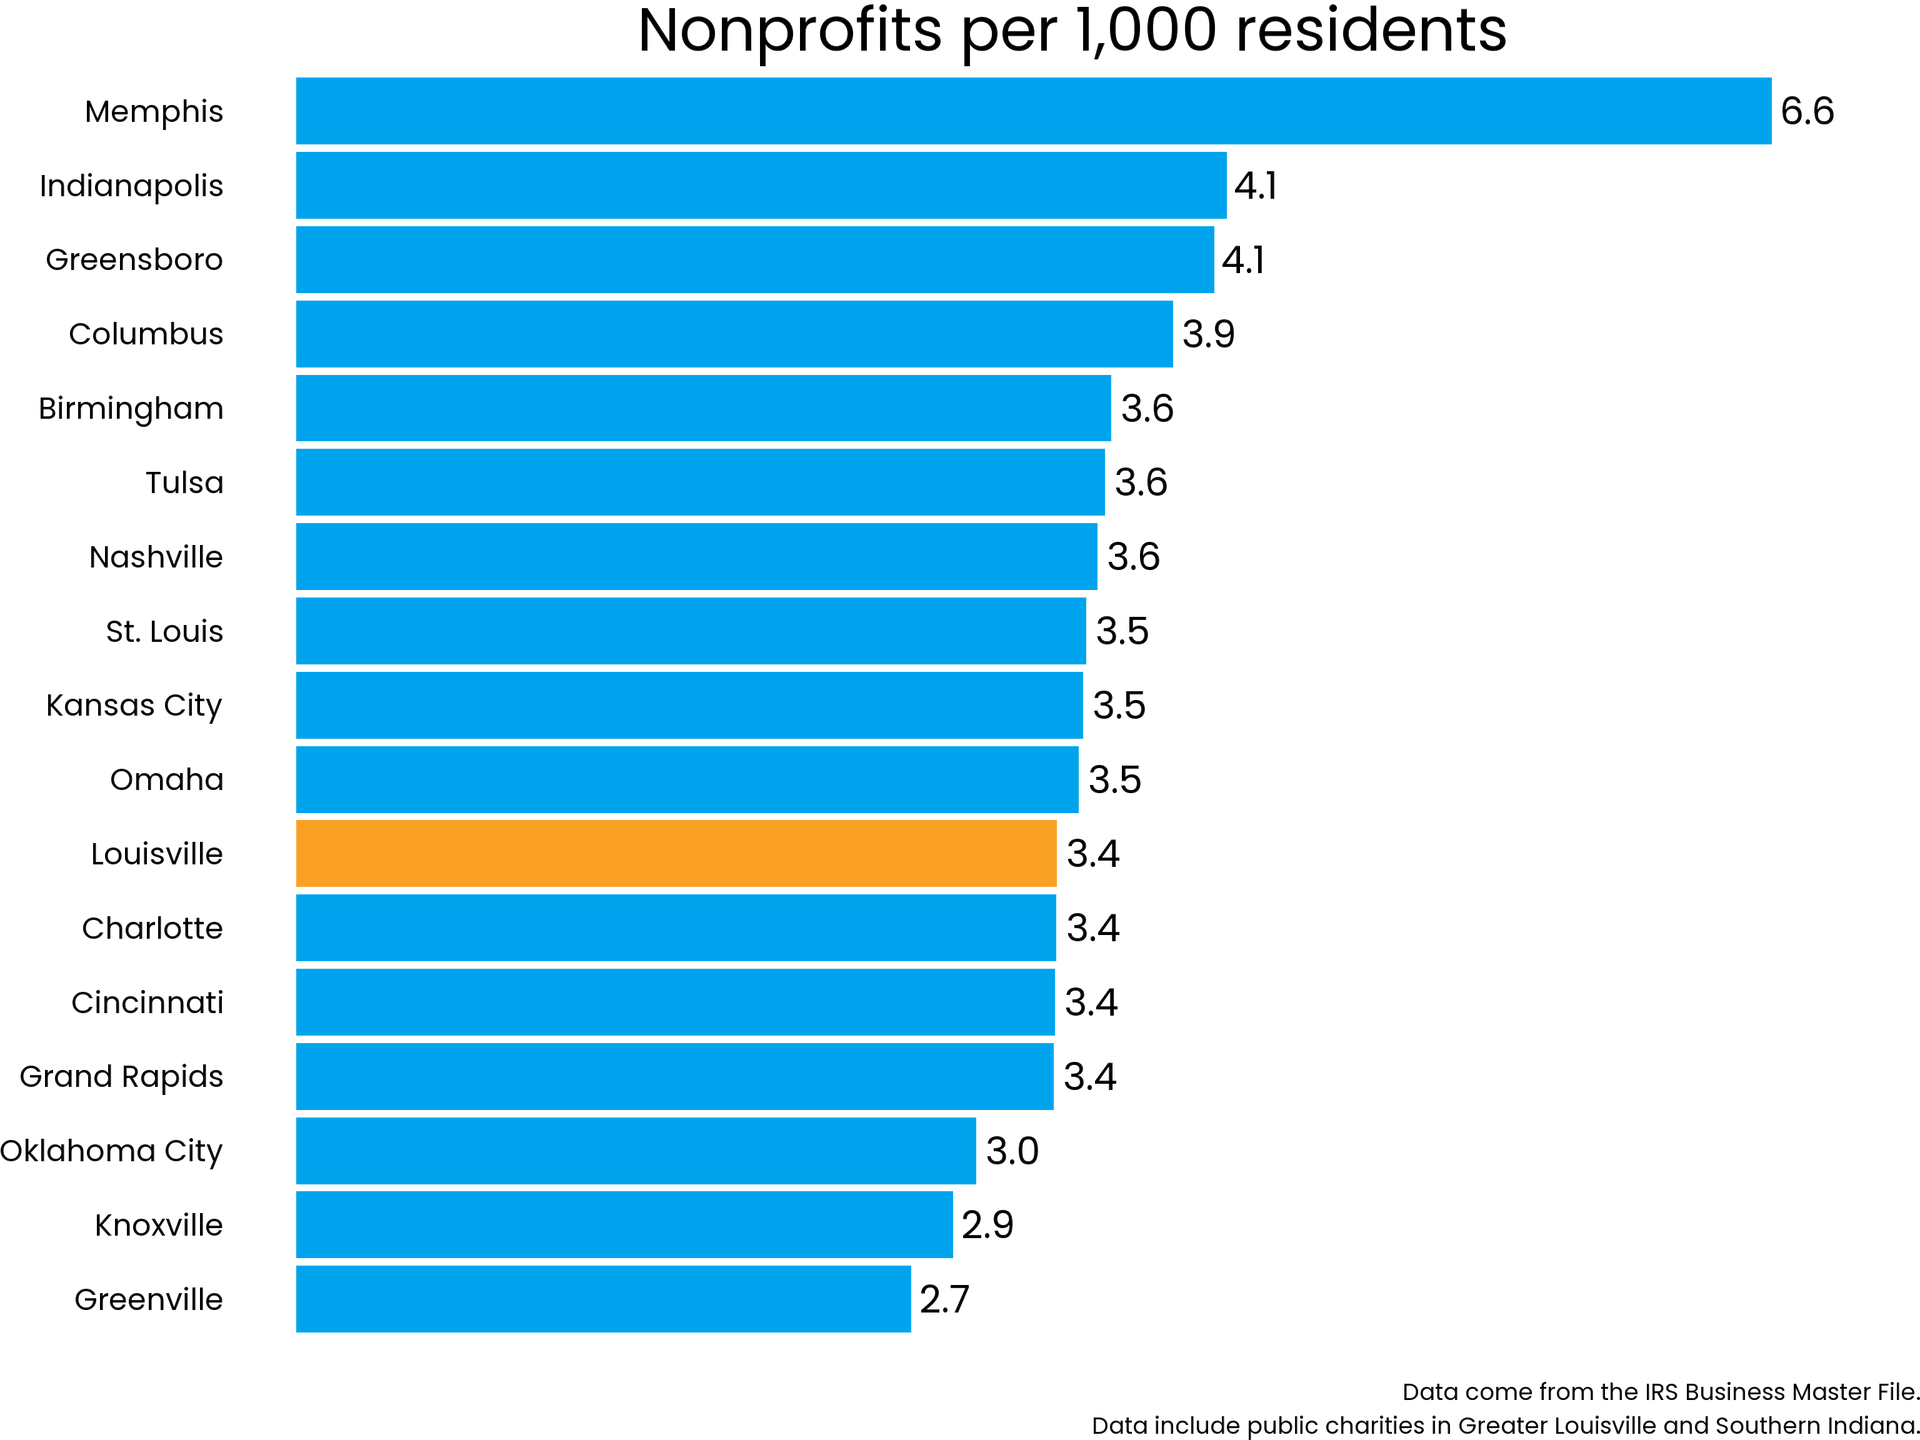
By that measure, the answer is no. Greater Louisville and Southern Indiana does not have an unusually high number of nonprofit organizations. The data indicates that Greater Louisville and Southern Indiana have, if anything, somewhat fewer nonprofit organizations than average for a community this size.
When compared to 16 MSAs that the Greater Louisville Project has identified as “peer” cities, we find that Greater Louisville and Southern Indiana rank in the bottom half, in 11th place. The average number of nonprofit organizations per 1,000 residents is 3.7 slightly more than our 3.4. At the top of the list are Memphis and Indianapolis, with Memphis having double the number of nonprofits we have, per capita.
When we combine this with the insights from a 2019 report from The Greater Louisville Project, we see a concerning picture. That report found that, when compared with peer cities, Louisville nonprofit organizations receive less than expected support from several sources. Our high-income households donate less money (as a percent of income) than those in peer cities. Our foundations are less well-endowed. Our local government is also spending less on some of the same issues.
A note from CNPE: Some types of nonprofit organizations thrive in a healthy community – like museums and performing arts groups. Other types are most needed when a community faces problems. Louisville has more than 20,000 homeless children, an increasing number of overdose deaths, has a high rate of food insecurity and spiking violence. Nonprofit organizations can be nimble and reactive in challenging times. They are incubators of new ideas and innovators of new techniques.
What kind of nonprofit organizations does Greater Louisville and Southern Indiana support?
Comparing ourselves to other communities by types of nonprofit organizations.
At the Center for Nonprofit Excellence, we believe that all types of nonprofit organizations can have value for their community – and we know that each community has different needs.
Having said that, we also understand that we can’t evaluate the health of a sector as a whole by looking just at the top-line numbers of total organizations. We love the performing arts – but we would find it strange if performing arts organizations made up 90% of our nonprofit organizations.
So, let’s take a deeper dive into the types of nonprofit organizations that are based in Greater Louisville and Southern Indiana. How do we compare to our peer cities in different categories of nonprofit?
Our community has fewer than expected nonprofit organizations in almost every category
On the whole, we have 7.9% fewer nonprofit organizations per capita than our peer cities.
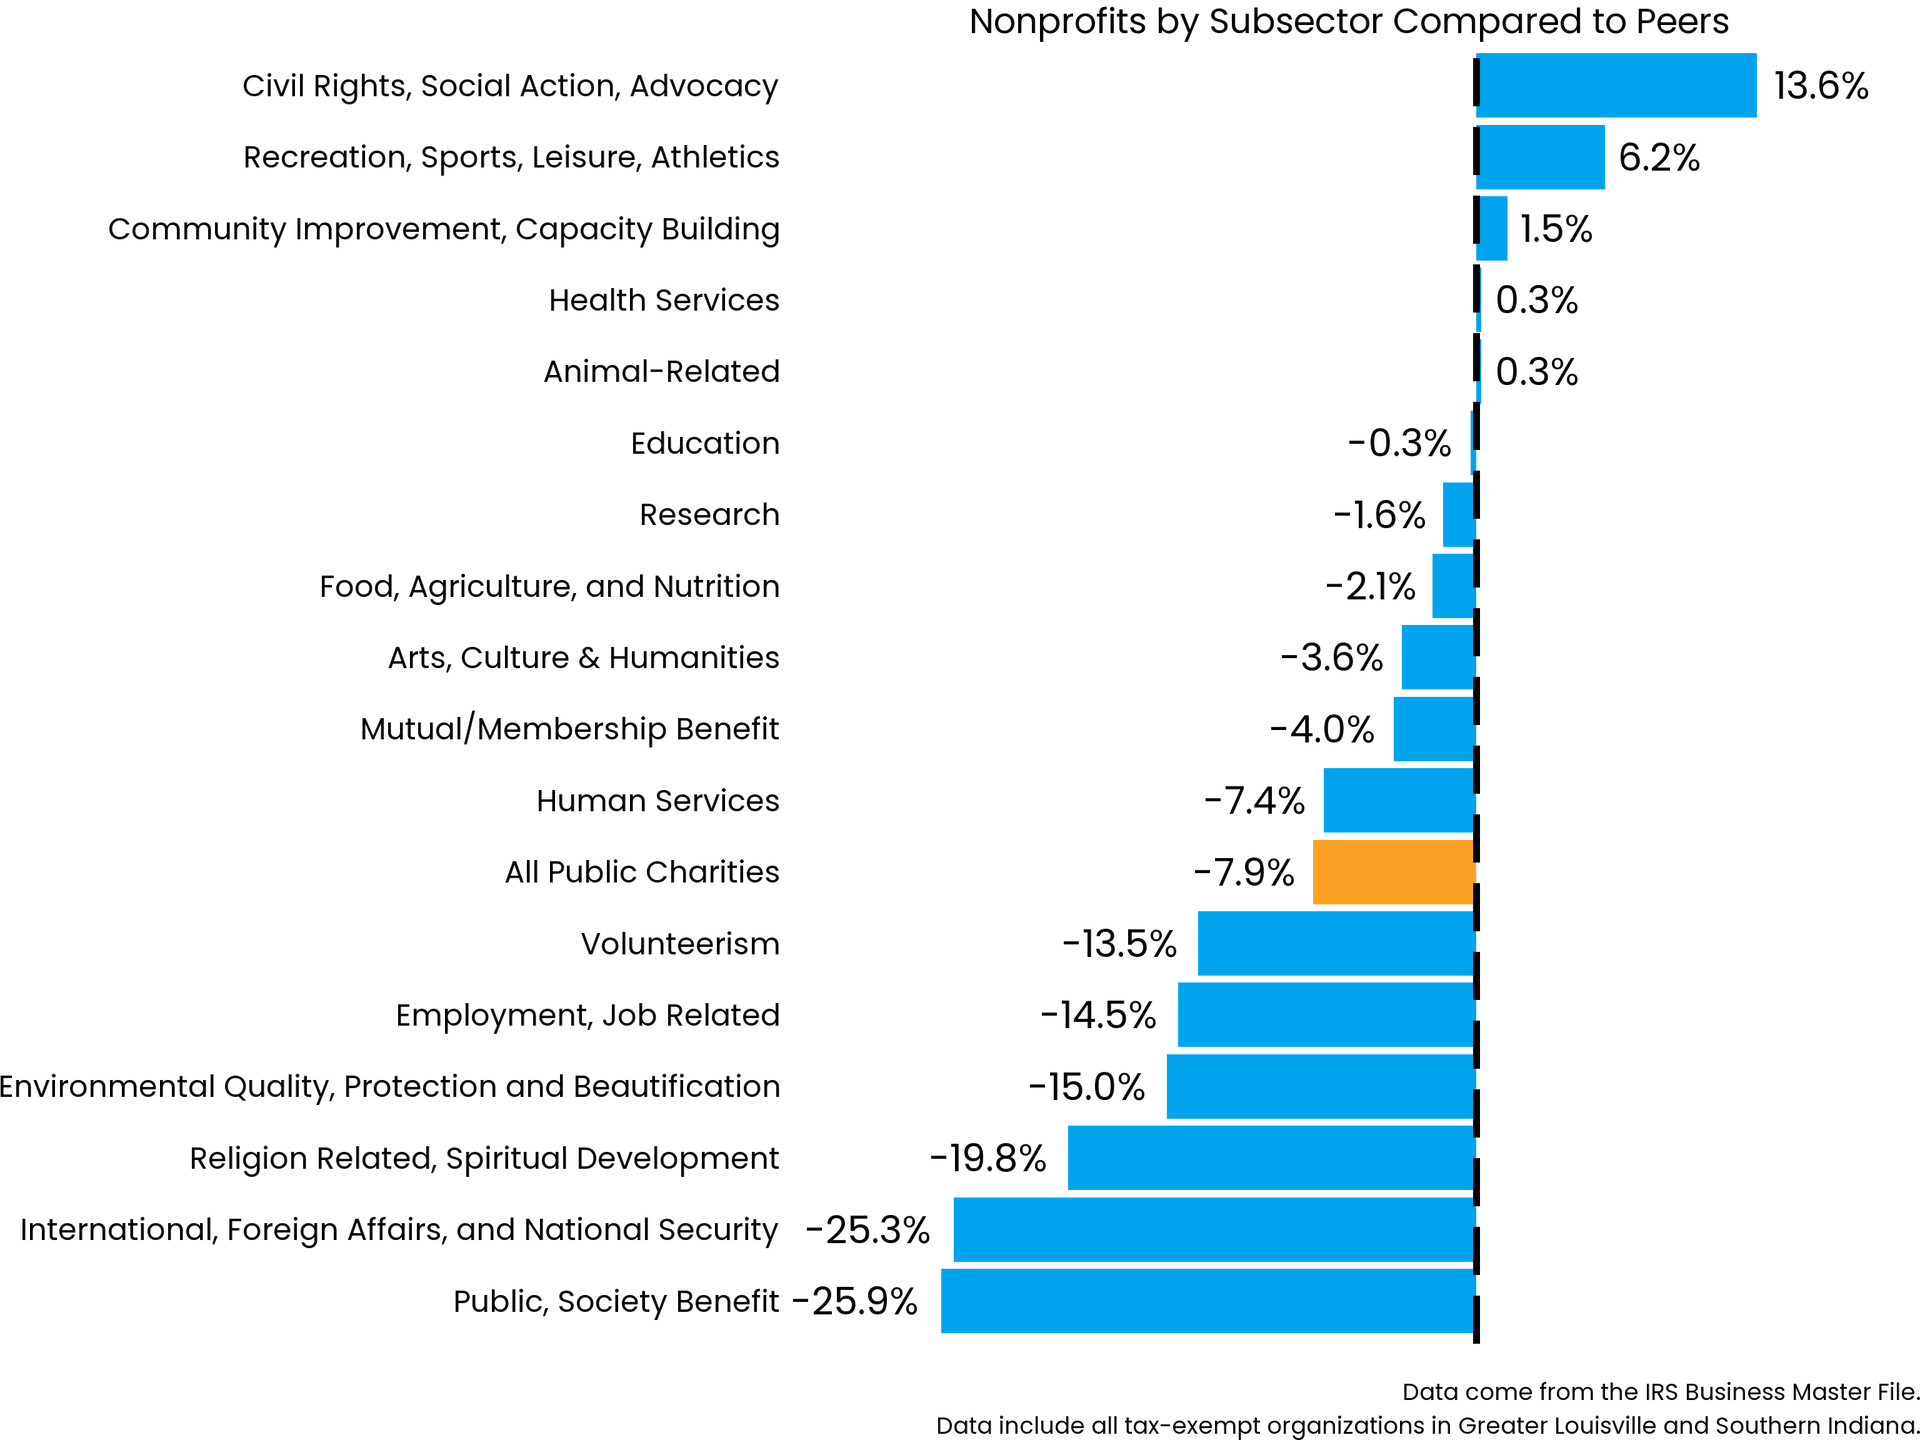
Here are some more specific numbers:
- We have 14.5% fewer nonprofits devoted to helping people find jobs
- We have 15% fewer nonprofit organizations working on environmental issues
- We have 13.5% fewer nonprofit organizations devoted to volunteerism.
What does this mean?
Again, this data can’t tell us whether these numbers are good or bad.
But we should think about the things that surprise us. For example, our community has been proud of its efforts to address food security issues. We are the home to Dare to Care, Blessings in a Backpack, and other organizations with national reputations. It may surprise people then to see that we have 2.1% fewer organizations devoted to food and nutrition than average for a community of our size. Or, on the other hand, we might conclude that having several high-profile organizations in that category may create a “consolidation” of efforts – where other cities may have several smaller, less successful organizations each working on the problem.
Considering the full context:
The health of any subsector should be measured by more than just the number of organizations – but by their size, funding, support, and scope.
Greater Louisville and Southern Indiana has significantly more nonprofit organizations than expected in only two categories – civil rights and sports & recreation.
Greater Louisville and Southern Indiana has 13.6% more civil rights organizations than expected for a city our size – and 6.2% more recreation, sports, leisure, and athletics organizations.
It might be tempting to assume that this means our community is unusually committed to civil rights or unusually athletic.
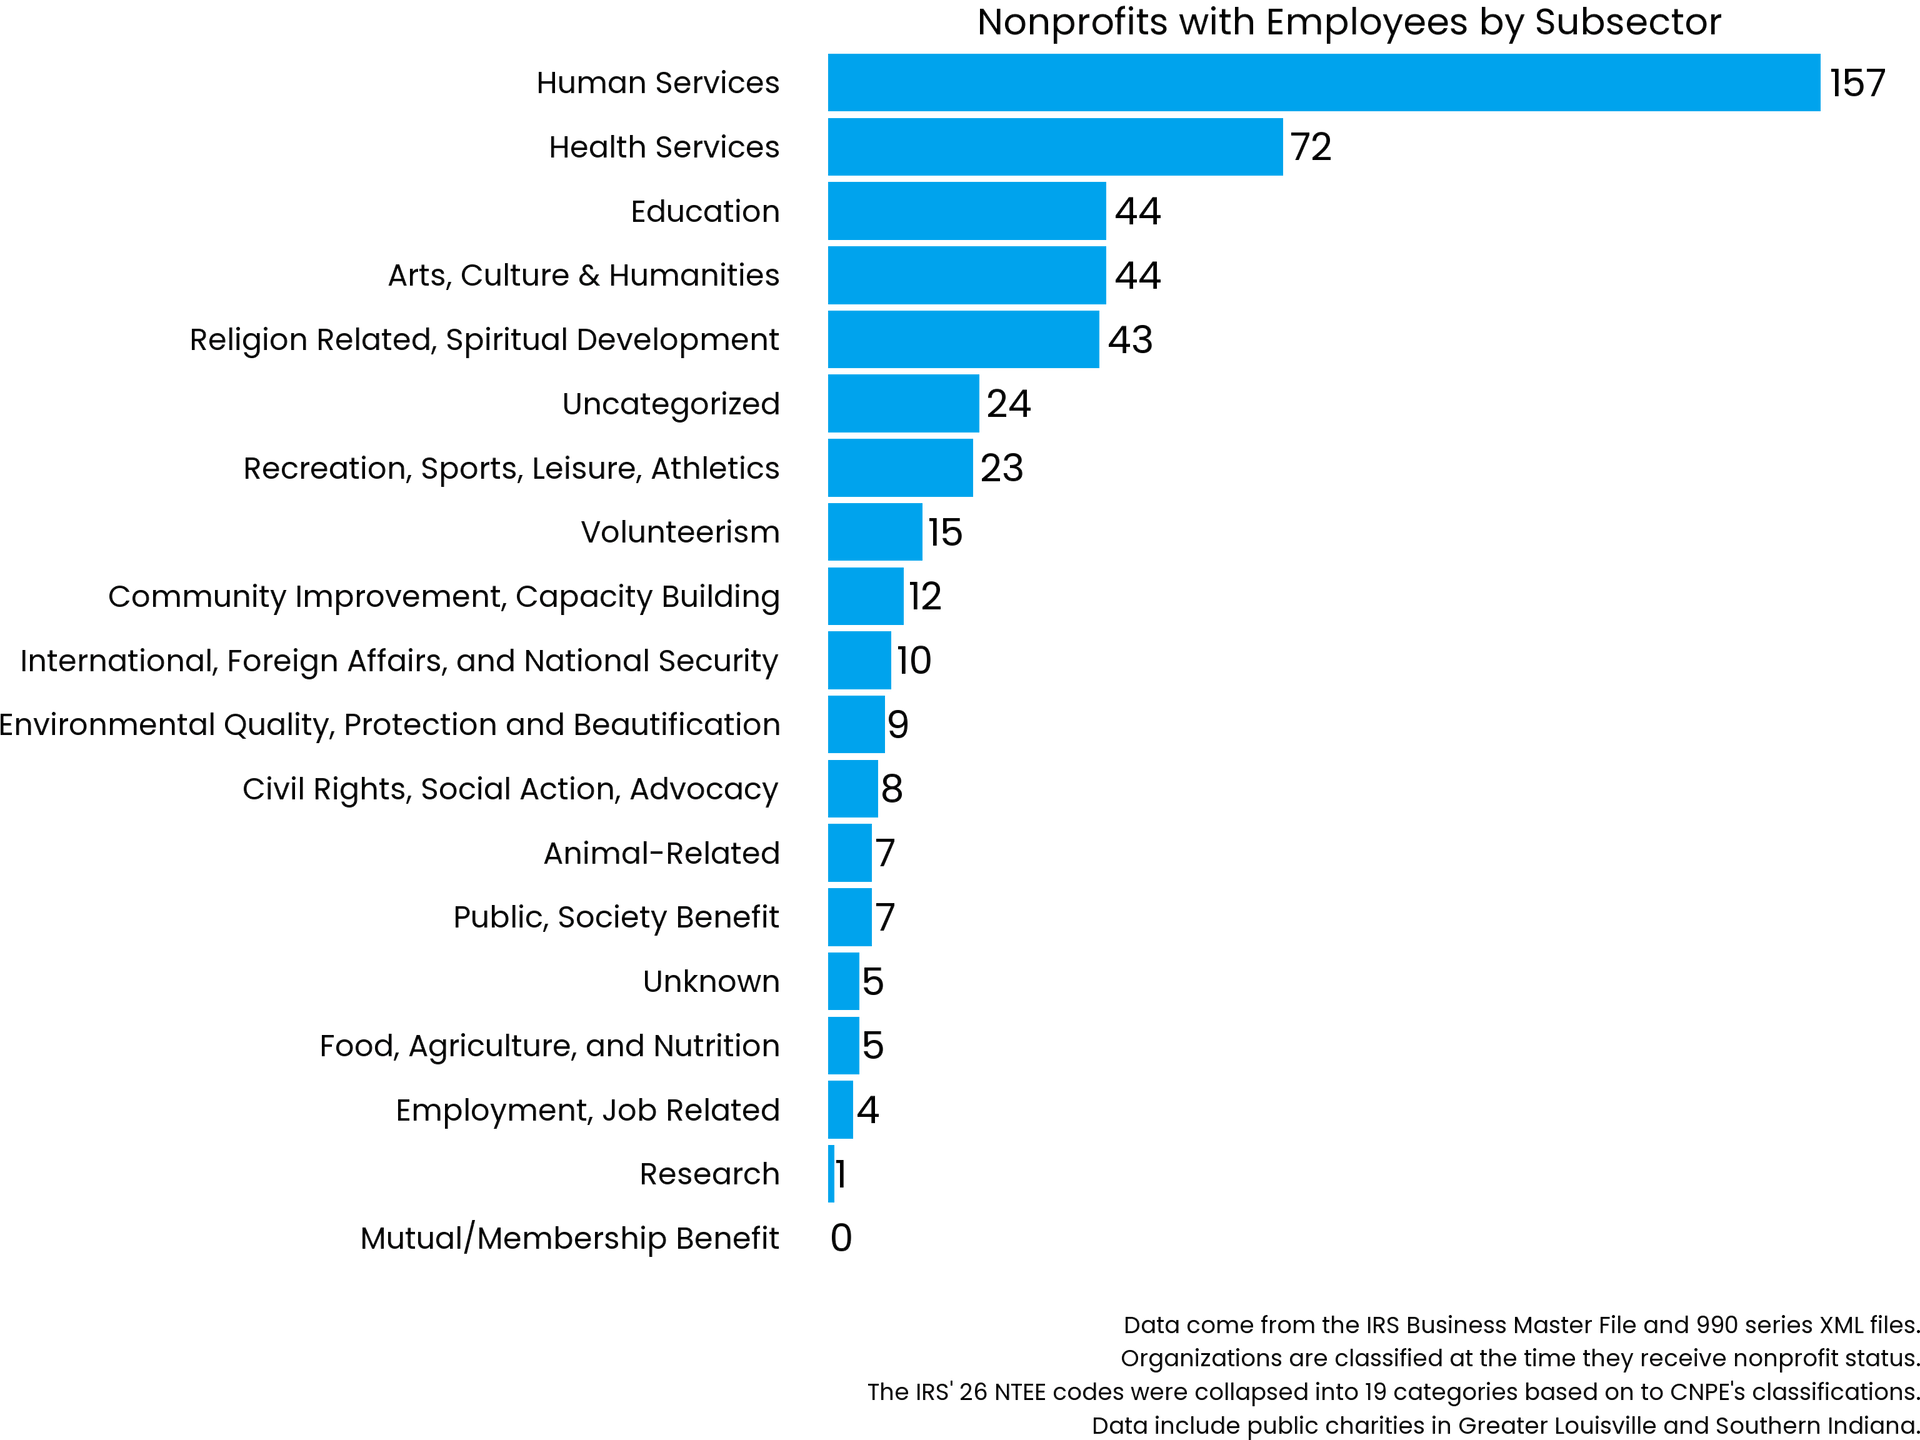
But when we look at these subsector charts, we see a more complicated picture, particularly on civil rights organizations. We have 34 civil rights organizations – with only 8 being large enough to have employees. That’s a lot of very small grassroots organizations. These organizations may be doing great work – but most of these organizations are not large or particularly well-funded.
It’s important to look not just at the number of organizations, but at their size, scale, and scope.
A note from CNPE: CNPE has a strong equity commitment and has deemed itself an anti-racist institution. We believe that we all benefit when organizations evaluate their programs for racial bias – as well as bias based on faith, sexual orientation, and gender identity. We need to ask deeper questions – not just about the number of civil rights-oriented organizations – but also about their access to funding and whether they have the tools they need to scale and grow.
Which subsectors are growing?
There are myriad ways to monitor the strength of subsectors of nonprofit organizations. Growth is one important way. As the population grows, there needs to be an equivalent growth to stay the same on a per capita basis.
An area that was once underserved may experience rapid growth as it “catches up.” Conversely, a merger between organizations with similar missions may result in an apparent shrinking of the subsector, even though the new organization could be stronger and more efficient.
The fastest-growing subsector is Animal Services, which grew by 14% over the four years. It is also interesting to note that sports and recreation – an area where we have a higher-than-expected number per capita – is also one of our fastest growing subsectors.
Conclusion: These numbers can’t tell us the optimal number of organizations to have for any subsector of nonprofit organizations are for any particular community. But there is nothing in the data to suggest that Louisville has an unusually robust nonprofit organization ecosystem. Growth is limited by funding and the opportunity for growth is to expand individual giving.
Instead of asking “Do we have too many nonprofits,” we might ask: How do we address social problems? What will it take to build a thriving community for all? Whose responsibility is it to address our community challenges? How well are we doing at solving the problems that nonprofits are focused on? Who should pay for the solutions?
TAKEAWAYS, CHALLENGES AND OPPORTUNITIES
____
This report answered some key questions, but other questions remain. Let’s look at what we know and what we still need to know.
Takeaways: What is the data telling us?
- Nonprofits have a huge direct economic impact. This impact can be measured in jobs, revenue, and payroll. (Nonprofits also have indirect economic impact by providing job training and tourism attractions – as just two examples.)
- Revenue is stagnant and revenue challenges are on the horizon – such as the end of the American Rescue Plan funds.
- No evidence supports the persistent myth that Louisville has “too many” nonprofits. On a per capita basis, when compared to our peer cities, we have fewer than average per capita.
What challenges and opportunities does this data prompt us to think about?
Challenges:
- Lack of revenue is an issue – but also a symptom. There is a general lack of awareness and understanding of the impact of nonprofits across our community, including by our elected officials. This ultimately translates into an inattention to the funding needs of the sector, resulting in stagnant and declining funding. That directly impacts the ability of nonprofits to meet community needs. A separate 2019 report from The Greater Louisville Project found that, when compared to peer cities, our nonprofit organizations receive less support from several key sources. High-income households give less and our local government is spending less to address these challenges than local governments in other cities. Due to the economic market, our foundations are also working with smaller endowments, and the number of nonprofits in the community far exceeds the foundation funding that is available. It’s also important to note that we may have lost a critical incentive for giving through the passage of the Tax Cut and Jobs Act of 2018. We should monitor the effects of changing federal and state tax incentives for charitable giving and potential long-term negative impact on individual giving.
- The post-pandemic labor shortage is putting pressure on wages. Rising wages are good for employees but require a matching growth in revenue. Attracting and retaining staff has been a challenge since the pandemic disruption. Exacerbating this issue for nonprofits is the fact that for those with government grants and contracts (federal, state, and/or local), a driving factor is that these contracts rarely, if ever cover the costs of the services provided. This results in wait lists for services – and in some cases, closed programs when nonprofits cannot maintain adequate staffing. Paying nonprofits for the services they are providing, paying nonprofits on time, and reducing unnecessary administrative burdens would allow nonprofits to recruit and retain the staff needed to meet community needs.
- Louisville is still struggling with equity. Since 2020, Louisville has begun to talk more honestly about its equity challenges, but we remain a largely segregated community – one where health, economic opportunity, and quality of life can all be predicted by the ZIP code someone was born in. This isn’t right – and it also complicates all of our other problems. Often the people with the best ideas and the best perspective do not have the same access to funding. Our “business as usual” approach, as a city, is not enough.
Opportunities:
- One of the biggest opportunities for revenue growth is increasing individual giving. The 2019 report from The Greater Louisville Project said if those who make more than $200,000/year raised their annual giving by simply 1% of their total income – that would put us on par with our peer cities for individual giving – and bring in an additional $80 million a year.
- Another important opportunity is growing and expanding partnerships with government and elected officials. In order to have effective partnerships, we must invest in building awareness, relationships, and understanding so we can work together to create large-scale community solutions.
- The new Louisville Nonprofit Coalition has formed to ensure a strong unified nonprofit voice and works closely with Metro Council and other city, state, and federal elected and governmental officials. This is to address issues impacting nonprofits, including efforts to eliminate barriers around contracting, timely reimbursements, and reporting.
- As the labor shortage gives workers more options about where they work, nonprofits can leverage the value of mission-driven organizations. There is no substitute for living wages, but we must also promote the value of doing work that matters, and we must develop work cultures that balance work, life, and self-care.
- As we work to improve equity, we will elevate new and valuable organizations and leaders. We should work to ensure all quarters of the nonprofit sector are full partners with government and the community as we work together to make Greater Louisville and Southern Indiana better – especially those organizations that are led by and serve Black and Indigenous People of Color, members of the LGBTQ+ community, and other minority communities. This will require personal efforts of building trust, relationships, and understanding – but also corrections to policies and systems that hold our community back. We need to work together with all sectors to shift our mindset, think creatively, and implement change.
Next steps
What is emerging for you? What ideas? Which questions? Let us hear from you.
Email us at communications@cnpe.org
Final note: More details about this report
Who compiled and analyzed the data?
The statisticians at The Greater Louisville Project are experts at compiling data from diverse sources. In this case, those sources included:
- the IRS Business Master File, which contains financial information on all U.S. nonprofits
- the Urban Institute’s National Center for Charitable Statistics IRS Business Master File archive
- the IRS 990 database, which contains annual information returns for all tax-exempt organizations
- the U.S. Bureau of Labor Statistics
After the data was assembled, the Greater Louisville Project and The Center for Nonprofit Excellence analyzed the results together.
Where did this data come from?
This data was gathered in late 2022, using the most recent reports available – which were generally from 2020 or 2021.
While nonprofit tax returns are generally available within a year of their filing, the data that we hoped would become available at the outset of the project did not marterialize. Per the IRS website, “Expect delays in data updates for the Tax Exempt Organization Search tool. We are still processing paper-filed 990 series received 2021 and later."
As for the year of data we included in the report, 42% were from tax year 2021, 47% were from tax year 2020, and the remaining 11% of organizations use data from 2022 or 2019 or earlier.
Board of Directors
Karina Barillas
La Casita Center
Mariana Barzun
Office of Mayor Craig Greenberg
Theresa Batliner
MCM CPAs & Advisors
Jordan Bond – Board Treasurer
YUM
Christen Boone – Board Chair
PNC
Dave Christopher
A.M.P.E.D.
Pam Darnall
Family and Children’s Place
Ralph de Chabert
Brown-Forman Corporation (Retired)
Mike Fine
Wyatt, Tarrant & Combs
Lori Flanery
New Directions
Ron Gallo
Community Foundation of Louisville
Stephen George – Board Secretary
Louisville Public Media
Andre Kimo Stone Guess
Fund for the Arts
Crystal Gunther
Community Foundation of Southern Indiana
Jill Horn, Emerita
Brown Forman Foundation
Adria Johnson
Metro United Way
Ashley Parrott – Board Vice Chair
The James Graham Brown Foundation
Mason Rummel, Emerita
The James Graham Brown Foundation
Bryan Warren
Educational Justice
Cassandra Webb
Cities United
Keni Winchester
Humana Foundation
Donald Vish, Emeritus
The Ginkgo Fund, Inc.